
The Complete Order Flow Trading Software Package To Help You Become A Better Trader...

Focusing on order flow changes everything! It is a better way of trading than the popular systems of indicators and messy indecipherable charts. Nothing could be simpler. No need for all those cluttered charts. Stop using charts cluttered with indicators. They are not helping you. They are cluttering up your decision-making process. They don’t even give you current market conditions.
Order flow is not a trading system by itself. Rather the order flow is the analysis of orders being traded as they flow into the market. The Orderflows Trader is software that allows the trader to see what is happening in the market in real-time giving an x-ray view into the market so the trader can see what exactly is happening as it happens. Once a trader understands what is happening in the present, the trader is able to make better decisions about what might happen in the future.
With order flow you can literally see market generated information that is impacting the market before price even starts to move. The markets trade in real time and most traders are very weak in analyzing the present market conditions. You have to trade in the present, you got to get in and get out in real time. So it just makes sense to analyze the present market conditions as best as you can to find better trade locations as well as near term support and resistance levels.
Order flow trading is a universal method of analysis that can be combined with just about any technical study. Technical indicators are based on complicated calculations to manipulate past price activity tend to mask the reality of what is happening in the market. Order flow goes right to the roots of what is happening now and lets you exploit that information for your benefit.
There are basically two types of traders in the market: the big guys and the small guys. You can replace those terms with names such as "Smart Money" and "Dumb Money" or "Institutional Traders" and "Retail Traders." You often hear people say "follow the smart money." Well, it sounds simple, but how can you figure out what the smart money is doing by looking at a normal bar chart? You can't. Order flow makes it very easy for you to determine which side is doing what at that moment by breaking down the volume that is actually being traded in the market.
The real power of Orderflows is that it identifies “hidden” trade locations that can’t be seen using traditional charting techniques. We built our own tools in order to process the order flow as it happens to help find the hidden trade opportunities within a bar. Nothing is more visual and reflects true market sentiment better than the Orderflows chart.
I Take You Through Several Days Of Analysis With Orderflows Trader.
It's time to stop flushing your money down the toilet on trading systems that don't work. Do you really think you can buy a trading system for $99 and turn your computer into a cash machine? Wake up and face reality. Everyone wants to make money trading but most people don't want to take the time to learn how to trade. Losing traders just want a system that is going to tell them to buy here or sell there.
I have been fortunate to work with some of the biggest and best traders in the world and one thing that they all have a solid trading methodology. They don't change their way of trading based on the next shiny trading object object that comes out.
Order flow is the key to understanding what is happening in the market. For many traders order flow is the missing link from trading being a break even venture to a profitable business because it teaches them to read the market and become a trader.


Albert Einstein was not a trader, but if he was alive today, who knows, he might be hired by some algo trading hedge fund. One of his famous quotes was "Everything should be made as simple as possible, but not simpler." As a trader, that is what you need to do, keep things simple. A big problem beginning traders face is they over complicate trading. An order flow chart keeps things simple for the trader. You are not looking at 10 different conflicting indicators. Everything you need to know about the market, the participants, the trend, and much more is contained in the order flow chart. Once you understand how to read it, understanding the market doesn't get any more simple.
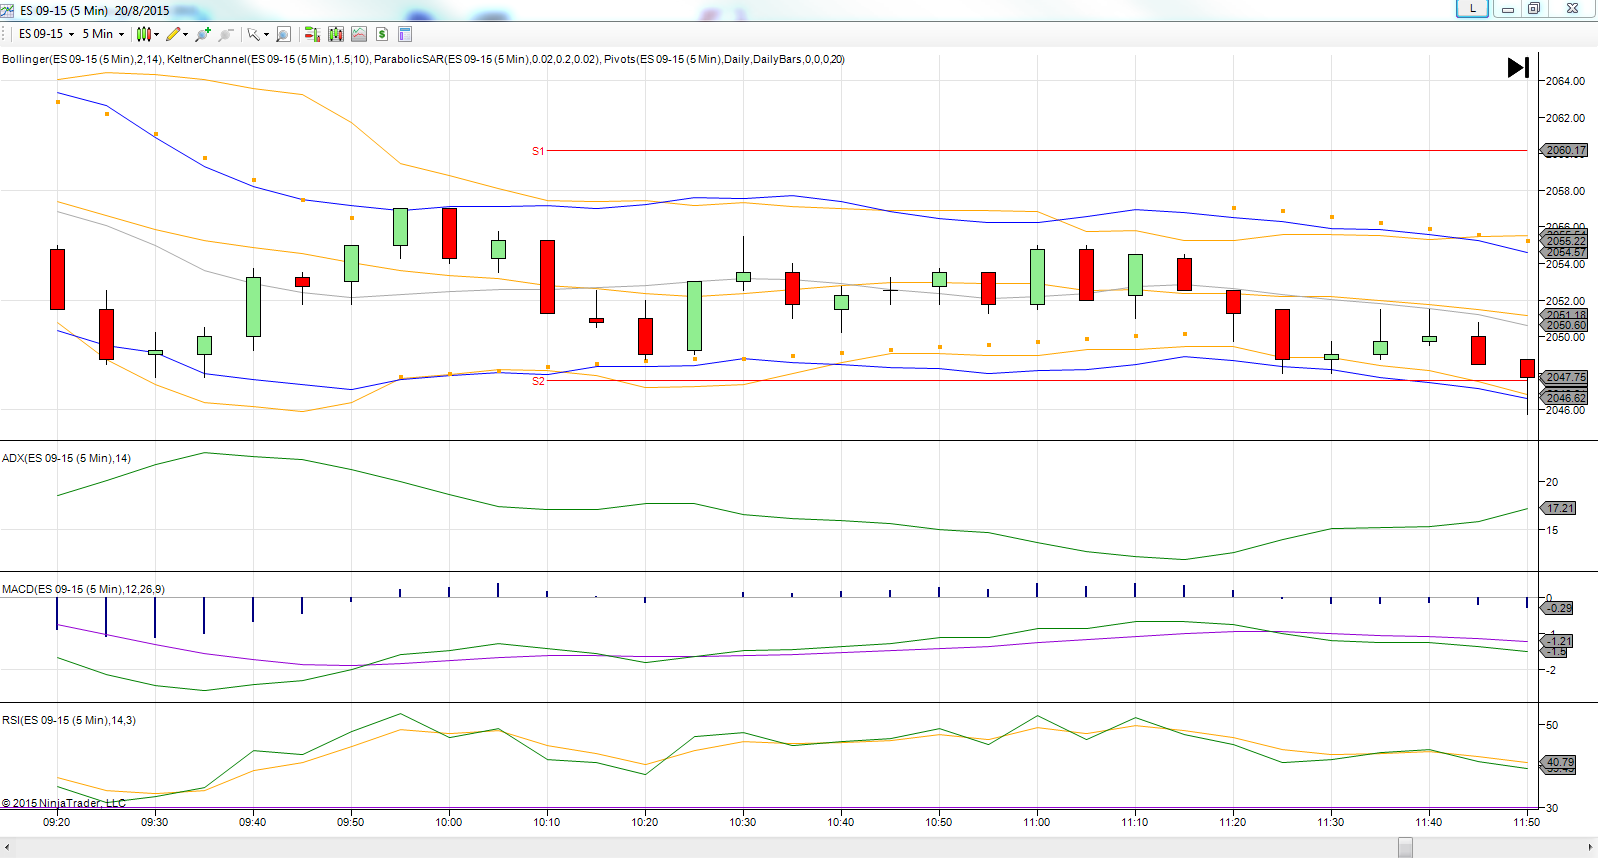
The problem for many losing traders is they rely on price based indicators to predict what the market is going to do. When you look at their screen it is littered with moving averages, MACD, RSI, stochastics, etc. These indicators are all correlated and don’t add any new insight into what is driving the market. They are only looking at price and massaging it into another number.

In the past, some of the best order flow traders were the pit traders. Why? Because they could see the flow of orders coming into the market from the brokerage houses, being filled and see what came next, was there more buying or selling. Now, the open outcry trading pit are closed and all the trading is done on computers. However, traders have come to realize that most of that information is available to the trader in its raw format.
The Orderflows Trader software takes the raw data of volume traded on the bid and volume traded on the offer and organizes it into an easy to understand chart for quick analysis. By combining price with bid/ask traded volume a trader has the best information possible for short term price movements. By seeing the volume traded on the bid and offers you will see clear clues as to whether the market is strengthening or weakening. With better organized price and volume information you will uncover profitable trading opportunities.

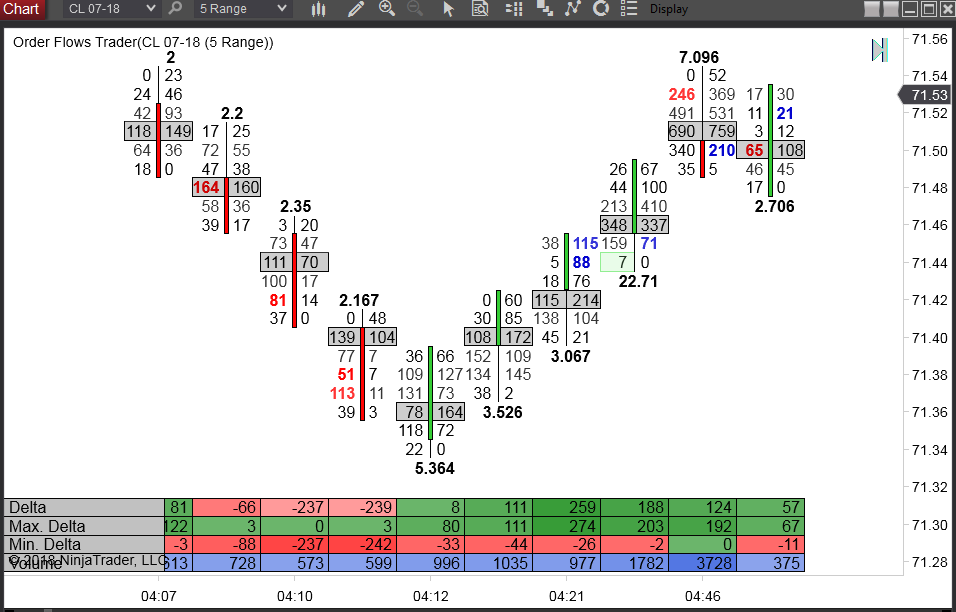
Prominent POCs allow you to see market generated support and resistance levels by highlighting prominent POCs (Point-Of-Controls) when they appear. Point Of Control is one of the corner stones of order flow and through our research we have identified the POCs that matter.
POCs by themselves often act as short term support and resistance for the next bar. Prominent POCs often act turning points in the market and confirm moves underway.
Cyan for supportive buying.
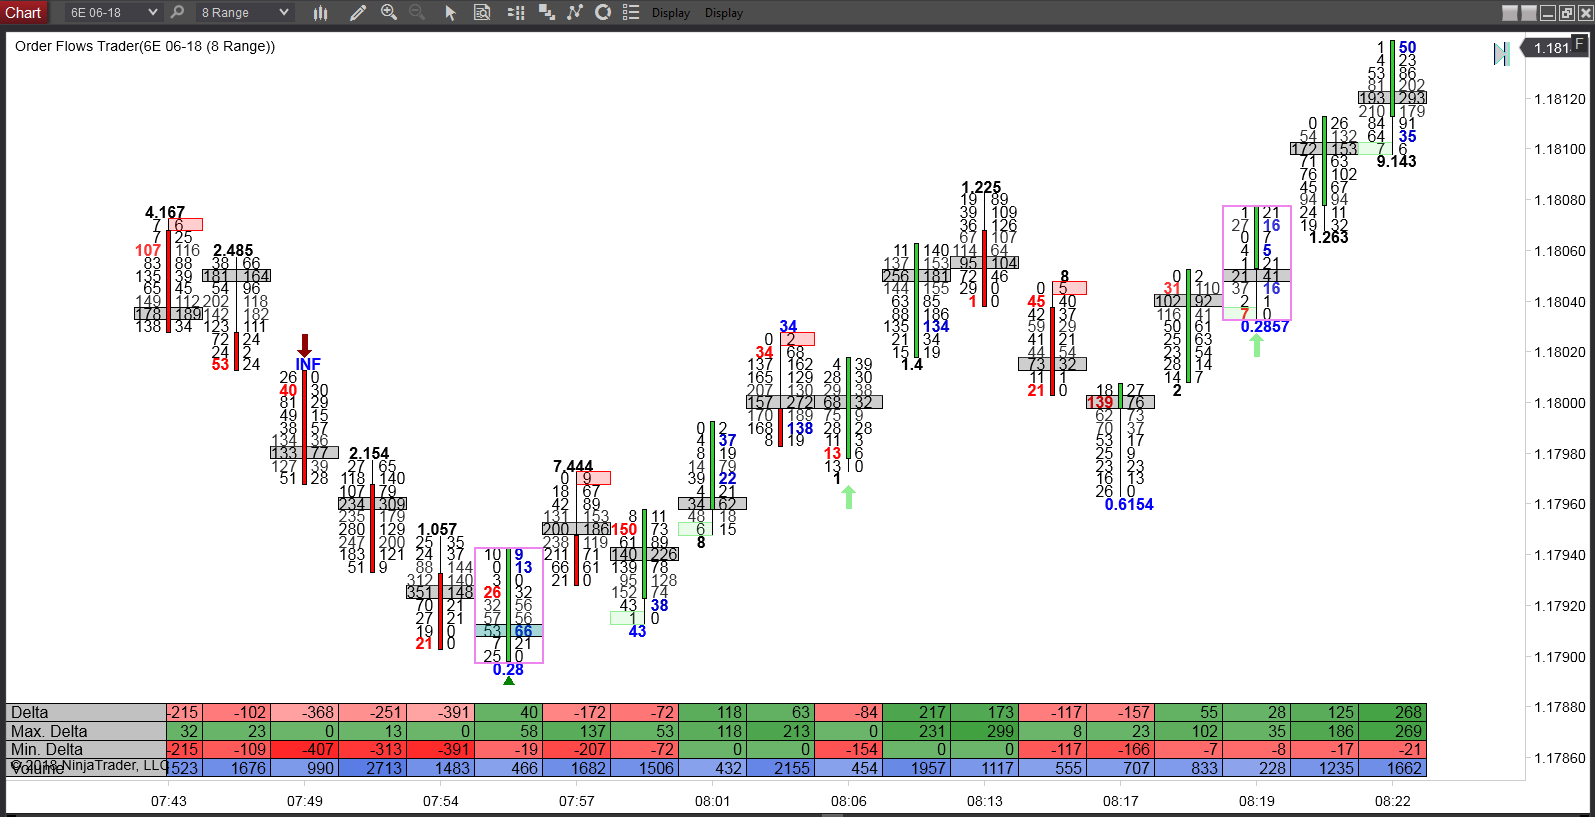
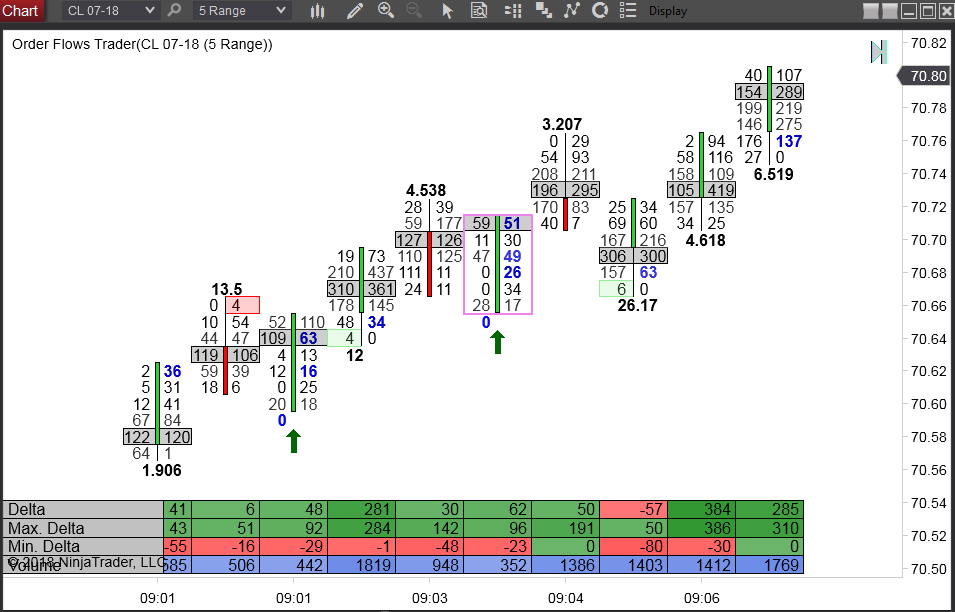
Zero Prints - New For NT8 Version of Orderflows Trader
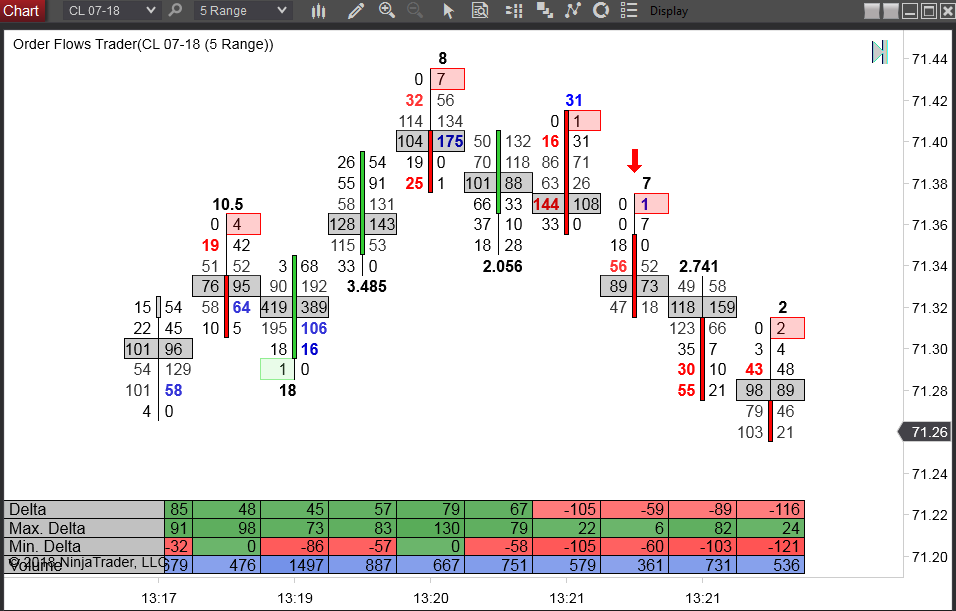
Zero Prints are often left as a result of sweeping orders in the market. When a trader sweeps the market, either buying or selling, it is often a sign of very aggressive trading. All the offers are lifted in a buying sweep and all the bids are hit in a selling sweep. This often results in zero prints in the footprint chart. The market is moving very fast and there is no counter trade occurring.
When a Zero Print appears you are alerted with a green arrow below the bar if it is a buying sweep or a red arrow above the bar if it is a selling sweep.
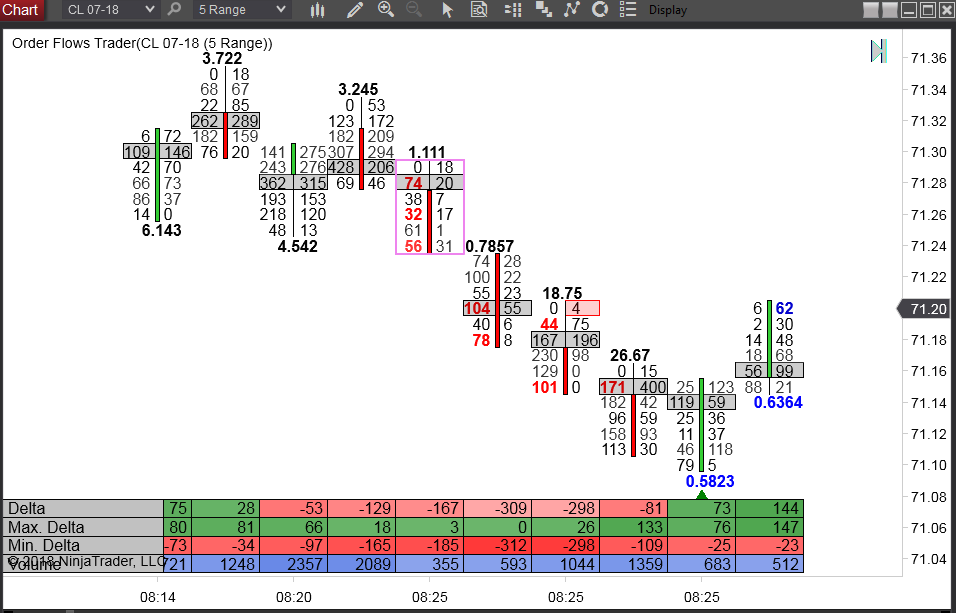
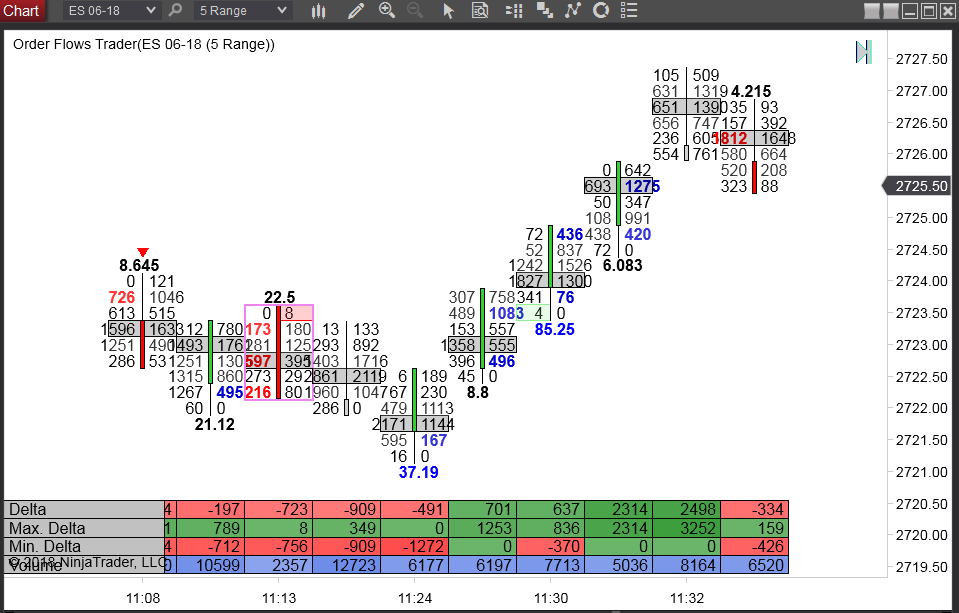
Multiple Imbalances occur when there are three or more imbalances in the same direction in a bar. As order flow traders we are fixated on looking for stacked imbalances in the bar. However, there are instances where there are bunches of imbalances in a bar that are not stacked nicely on top of each other yet they are just as important to the trader.
Orderflows Trader draws a box around the entire bar to highlight when a multiple imbalance occurs so you can easily identify those trading opportunities.
Orderflows Divergence
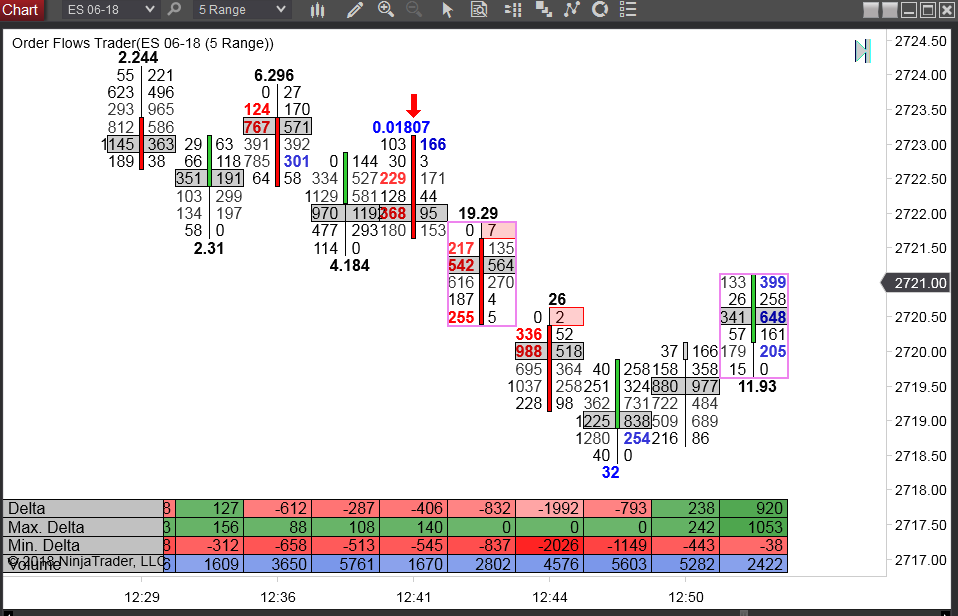
An Orderflows Divergence Buy appears when the market makes a new or equal high, has a negative delta and the price action of the bar is negative, meaning the bar closed lower than where it opened. Why is that important? The market has been rallying but aggressive sellers have stepped in and become dominant in the market.
An Orderflows Divergence Sell appears when the market makes a new or equal low, has a positive delta and the price action of the bar is positive, meaning the bar closed higher than where it opened. Why is that imporant? The market has been selling off but aggressive buyers have stepped in and active in the market.

Trapped Traders is a term you hear a lot in order flow, but no one really explains it. They just say "There are trapped traders here and point to a chart." The Orderflows Trader software highlights areas where trapped traders appear in the market.
There are times when traders get excited when a market is rallying or selling off and they show up late to the move and either buy the high or sell the low and find themselves trapped in a losing position as they market reverses right after they entered their position. These traders can't take the heat of a losing position and work on getting out of the position at a low. When you can identify trapped traders you give yourself a nice low risk short term trade.
Ratio Bounds Low is another original tool developed by myself and now copied by other order flow software. What a Ratio Bounds Low does is measure the order flow and prints a number above a red candle or below a green candle and depending on what the ratio number is it will indicate to you if there is stopping volume at the current price level.
Ratio Bounds Low signal price support/defense which is evident at swing lows and highs as well as in trends to confirm the direction of a trend. Often when a Ratio Bounds Low appears the market stops in its tracks.
There are players in the market who are so big that their actions can determine if a trend stops or starts. These large institutions know market has moved out of supply and demand balance and act accordingly. The beauty of order flow analysis is that their actions can be seen in the analysis of volume.

Ratio Bounds High is an original tool developed by me and now copied by other order flow software. What a Ratio Bounds High does is measure the order flow and prints a number above a red candle or below a green candle and depending on what the ratio number is it will indicate to you if there is price rejection at the current price level.
Ratio Bounds High signal price rejection which is evident at swing highs and low as well as in trends to confirm the direction of a trend.
Single Prints is another unique Orderflows Trader tool.
The power of order flow is to be able to see the volume being traded on the bid and the volume being traded on the offer. When single prints appear the market is telling you that the last buyer has bought or the last seller has sold. When you take it in context of the market, single prints often occur at turning points in the market. After all, when there is no more buying in a move up, what will happen next? The market will sell off.
Wouldn't you like to know when the last buyer has bought or the last seller has sold? Only Orderflows Trader highlights to you single prints when they occur.
Delta is one of the most powerful tools in order flow analysis, yet is among the least understood. Order flow delta is the difference between aggressive buyers and aggressive sellers. There are never more buyers than sellers nor more sellers than buyers. Instead what what causes the markets to move up is when there are more aggressive buyers than aggressive sellers. What causes a market to move lower is when there are more aggressive sellers than buyers.
The Orderflows Trader software takes the trades as they occur either on the bid or offer and organizes it so you can determine what the aggressive buyers and aggressive sellers are doing in the market. There are so many profitable ways to use delta.

My goal is to get you up to speed trading with order flow as quickly as possible and to facilitate that I include:
Orderflows Guide To Trading Order Flow – A 150 page guide that has all the information, all of the techniques, all of the tips, and all of the strategies you need to trade order flow successfully.
Custom Orderflows Indicators – These special indicators are the same ones we use in our live trading.
My Custom Orderflows Chart Templates – I include my very own chart templates to get you up and running quickly. You don't have to mess around trying to set up your charts to look like mine. Just copy and paste into NinjaTrader 8's chart folder and you are good to go.
Orderflows Quick Start Tutorial – Get up and running in the fastest amount of time possible without any of the complications. Stop wasting hours of time and getting frustrated trying to set up everything.
You aren’t going to become a successful trader by trial and error. It’s almost impossible to learn that way, unless you want to have a very expensive education. You may already be aware of that, having learned the hard way.
There is just too much involved for trial and error to work. You need something that gives you an edge over the rest of the traders out there. Trying to “figure it out on the fly” is too risky. It’s unlikely that you’ll succeed if you have to keep reinventing the wheel. And there is no way to succeed if every lesson learned from trial and error costs more of your trading capital.
You need to learn how to trade based your understanding of the market, not because one squiggly line crossed another squiggly line. Become a trader, not a trade taker.
The software runs on the NinjaTrader trading platform which you can download for free at ninjatrader.com (yes, it will run on the free version too).

Bonus #1: Lifetime Access To The Order Flow Trading Course - Normal Price $297. Yours Today For FREE!
Let's face it, you can spend countless hours trying to learn how to read order flow yourself and lose money while trying to "pick it up" or you can take this course and learn from an expert and put yourself ahead of the learning curve.
The Orderflows Trading Course is a unique home study video course designed to provide you with a complete education of Order Flow Analysis of Futures Markets: to help you understand a footprint chart, areas of price rejection, where strong volume is appearing, how to find hidden trade opportunities and much more. It is the only complete, accurate stand alone course on Order Flow Trading developed by a trader for traders.
The Order Flow Trading Course provides you with an opportunity to:
• Learn to use one of the most powerful trading tools.
• Learn how to identify high probability trading opportunities.
• Learn to understand how each day's highs and lows are built and traded.
• Learn to interpret market imbalance developments.
• Learn to quickly read the order flow chart and identify market direction.
• Learn to trade the different types of Price Developments in the market.
• Learn to quickly identify trends and join them as soon as they begin.
• Learn to identify whether sellers or buyers are in control.
• Learn how to understand why the market behaves the way it does.
• Learn to identify when prices are accepted or rejected by the market.
• Learn how valuable order flow information can be combined with traditional technical analysis for maximum gains.

A couple of years ago I created the Orderflows Inner Circle.
The purpose of the Inner Circle was to advance traders knowledge of order flow
and provide the latest order flow indicators.
This information builds on what is taught in the Order Flow Trading Course.
Think of it this way...The Order Flow Trading Course is like a university level 101 class.
This Inner Circle Video Club is like a university level 401 class.
It is advanced analysis not only by me, but by other traders.
So what I have done is created a special package for traders who want to access to the recorded
order flow analysis trainings without paying for the additional NinjaTrader indicators which you don't need.
Currently there are 56 recorded videos on a variety of order flow topics:
Delta
POC
Imbalances
Unfinished Business
Breakouts
Swing Trading
Hidden Aggression
Double Tops (one of my personal favorites)
Declining Volume
And much, much more...
Normally the Orderflows Pulse sells for $350 on my website. But as a bonus when you purchase the Orderflows Trader 3.0 for NinjaTrader 8 through the link below you will get it for FREE.
One of the most useful ways to use order flow is to help ensure you are positioned to catch a move. This is why I created the Orderflows Pulse
indicator because I wanted to let the computer analyze the order flow and tell me when the market is getting ready to move instead of being flatlined.
The Orderflows Pulse order flow indicator combines the best of two worlds, providing high quality order flow analysis automatically
while maintaining complete flexibility, allowing users to adjust the parts of order flow used in the analysis.
The Orderflows Pulse isn't some simple price pattern. It's not a 3-up bars so you buy type of method...or anything so obvious. No, while it's easy to apply, but its not easy to find. It combines different parts of order flow analysis such as point of control, delta, imbalances and bid x ask volume as well as regular market analysis such as price action and swing analysis.


Normally the Orderflows Turns sells for $500 on my website. But as a bonus when you purchase the Orderflows Trader 3.0 for NinjaTrader 8 through the link below you will get it for FREE.
Orderflows Turns tools analyzes the order flow in a bar to generate potential market turning points. Areas where prices are being supported and defended.
The Orderflows Turns Indicator analyzes:
-Point Of Control.
-Volume traded on the bid and offer.
-Volume.
-Price action.
-Delta.
-Swing analysis.


Each Monday night at 7pm Central Time, you are welcome to join in my weekly live group training session for users of Orderflows Trader. The only way to get access to this group is by being a user of Orderflows Trader. These sessions last about an hour and covers various topics of order flow and will help you to understand the software better as I show you what how to use it more efficiently.
We want you to succeed in trading. That is why we offer so much more training in addition to software. The key is for you to understand and trade with order flow. We created Orderflows Trader and our training as a result of a need to centralize the knowledge we have been sharing publicly about trading with order flow.
You can spend the next year and a lot of money trying to learn how to trade order flow on your own with a lot of tears and frustration. Or you can spend the next couple of weeks and get it. Imagine being in line at Disneyland and Mickey Mouse comes up to you and offers you a chance to jump to the front of the line? What would you do? Say no and continue to stand in the hot sun or jump ahead of everybody else? The choice is yours. Get started now.

ORDERFLOWS TRADER 2.0
AT A SPECIAL PRICE!
For a one time payment of just $1250 you get lifetime access to:
Orderflows Trader 3.0 for NinjaTrader 8
My Book On Trading Order Flow - Trading Order Flow
My Top 3 Order Flow Trade Setups
Weekly Live Group Order Flow Training
…and don’t forget the bonuses:
Order Flow Trading Course
Orderflows Inner Circle Video Training
Orderflows Pulse Indicator
Orderflows Turns Indicator
If purchased separately, it would cost you over $2500.
But you can get this package today for just $1250.
A savings of over 50%

Please allow 3 to 6 hours for us to process your order. We will email you all the necessary files as soon as your order is processed.
Orderflows Trader 3.0 runs on the FREE as well as PAID version of NinjaTrader 8. You can download it from Ninjatrader.com Be sure you are on version 15 or higher.
I feel the best data provider that works with NinjaTrader and Orderflows Trader is Kinetick. However you can use your existing NinjaTrader data feed of CQG, IQ Feed, eSignal, etc.
No. NT7 is the PAST. The Orderflows Trader for NT8 is specifically designed to run on NT8 and take advantage of the framework of NinjaTrader. If you are using NT7, it is time to switch to NT8.
Your purchase is 100% Risk Free. We fully stand behind our products and ensure they over-deliver. And this is what we have tried to achieve with Orderflows Trader.
So if you’re not happy with Orderflows Trader for any reason, simply let us know within 14 days of the purchase and we’ll happily refund your money. No hassle, no questions asked, it is that simple!
Yes, if you currently own the NT7 version of Orderflows Trader or an older version of Orderflows Trader for NT8, you can upgrade for FREE. Contact us for upgrade.
so make sure to act fast to get this incredible deal at this price.
All Rights Reserved. Reproduction without permission prohibited. All of the foregoing is commentary for informational purposes only. All statements and expressions are the opinion of Orderflows.com and are not meant to be a solicitation or recommendation to buy, sell, or hold securities. The information presented herein and on our web site has been obtained from sources believed to be reliable, but its accuracy is not guaranteed. Estimates, assumptions and other forward-looking information are subject to the limits of forecasting. Actual future developments may differ material due to many factors.
Hypothetical or Simulated performance results have certain limitations, unlike an actual performance record, simulated results do not represent actual trading. Also, since the trades have not been executed, the results may have under-or-over compensated for the impact, if any, of certain market factors, such as lack of liquidity. Simulated trading programs in general are also subject to the fact that they are designed with the benefit of hindsight. No representation is being made that any account will or is likely to achieve profit or losses similar to those shown.
Disclaimer:
This presentation is for educational and informational purposes only and should not be considered a solicitation to buy or sell a futures contract or make any other type of investment decision. Futures trading contains substantial risk and is not for every investor. An investor could potentially lose all or more than the initial investment. Risk capital is money that can be lost without jeopardizing ones financial security or life style. Only risk capital should be used for trading and only those with sufficient risk capital should consider trading. Past performance is not necessarily indicative of future results.
Risk Disclosure:
Futures and forex trading contains substantial risk and is not for every investor. An investor could potentially lose all or more than the initial investment. Risk capital is money that can be lost without jeopardizing ones’ financial security or life style. Only risk capital should be used for trading and only those with sufficient risk capital should consider trading. Past performance is not necessarily indicative of future results.
Hypothetical Performance Disclosure:
Hypothetical performance results have many inherent limitations, some of which are described below. no representation is being made that any account will or is likely to achieve profits or losses similar to those shown; in fact, there are frequently sharp differences between hypothetical performance results and the actual results subsequently achieved by any particular trading program. One of the limitations of hypothetical performance results is that they are generally prepared with the benefit of hindsight. In addition, hypothetical trading does not involve financial risk, and no hypothetical trading record can completely account for the impact of financial risk of actual trading. for example, the ability to withstand losses or to adhere to a particular trading program in spite of trading losses are material points which can also adversely affect actual trading results. There are numerous other factors related to the markets in general or to the implementation of any specific trading program which cannot be fully accounted for in the preparation of hypothetical performance results and all which can adversely affect trading results.
©Orderflows.com
