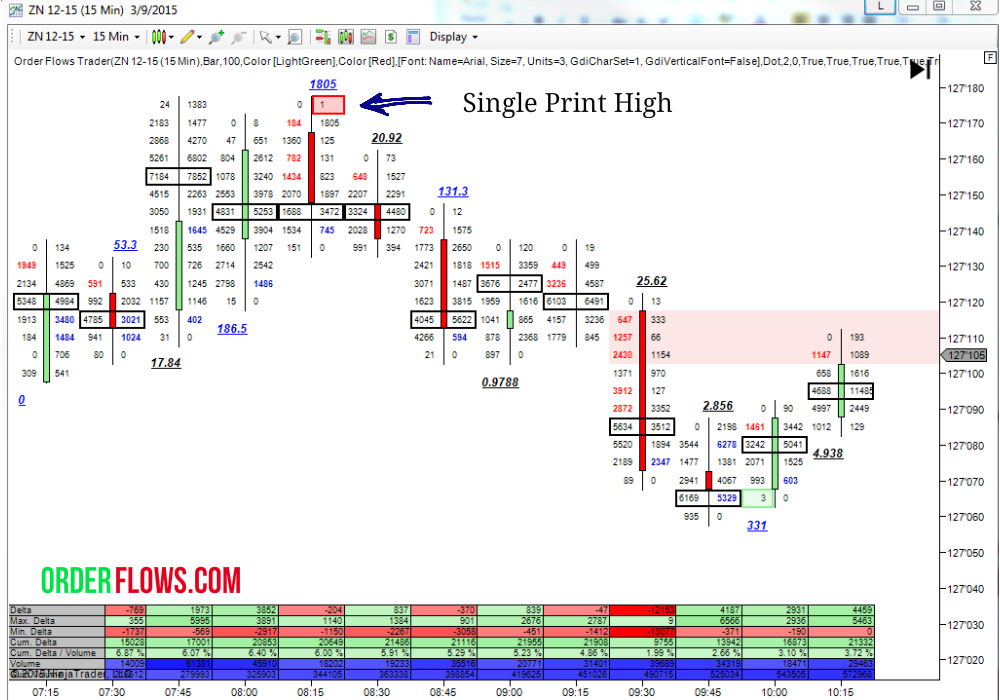
Single Prints – Last Buyer / Last Seller
Markets turn when the last buyer has bought at a high or when the last seller has sold at a low. With traditional bar charts you only see the low of the bar or the high of the bar. You cannot judge the internal buying or selling that has been apparent inside the bar. Orderflows has created the single print box indicator to highlight on the chart where their activities are.
What is the importance of the last buyer / last seller? It is important because it potentially signals the end of the move. No one wants to buy or sell anymore. The price has gone too high or too low. It is at an extreme.
Think of it in real life terms. Imagine you sell beer. There is a lot of demand so you raise prices, but people keep buying. At some point people have drank a lot of beer and don’t want to drink anymore and by now the price is too high. So you might get 1 or 2 more beer sales before everyone stops buying beer and you find yourself lowering the price to get more interest and get people to buy again.
One of the truths about the markets is that when prices go up but people stop buying, prices go down. Sometimes it is quite obvious. You can see it in the Orderflows Trader generated charts.
It works both on short term and medium term charts. It can be used as a scalp trade or a swing trade.
I designed this indicator and Orderflows Trader is the only software that highlights this type of market activity.