Orderflows Trader 5.0: See Levels With Bullish/Bearish Order Flow
Yesterday we released the latest upgraded version of Orderflows Trader, Version 5.0.
Among the big upgrades is being able to draw out zones of bullish or bearish order flow so you can take advantage of them when the market comes back to test the level.
To get started with Orderflows Trader 5.0, go here:
https://www.orderflows.com/oft5.html
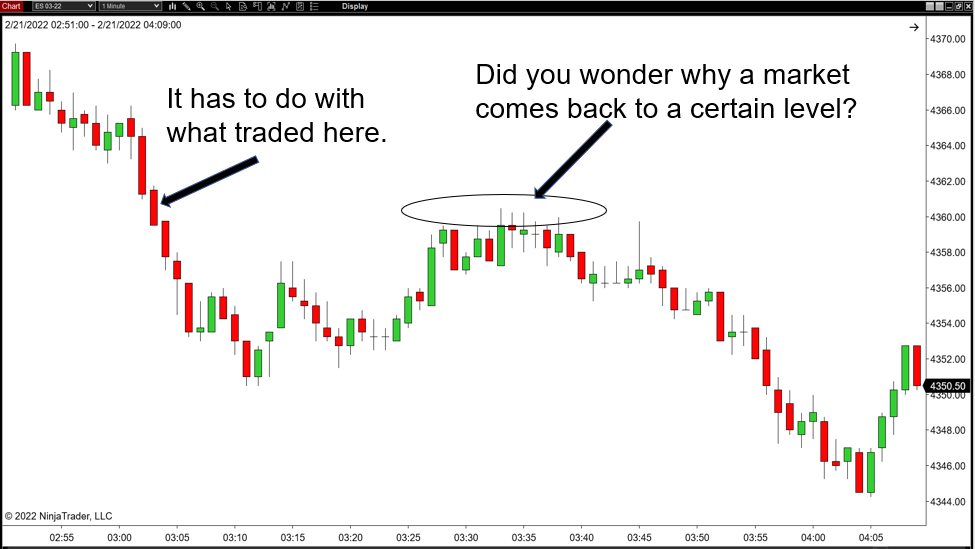
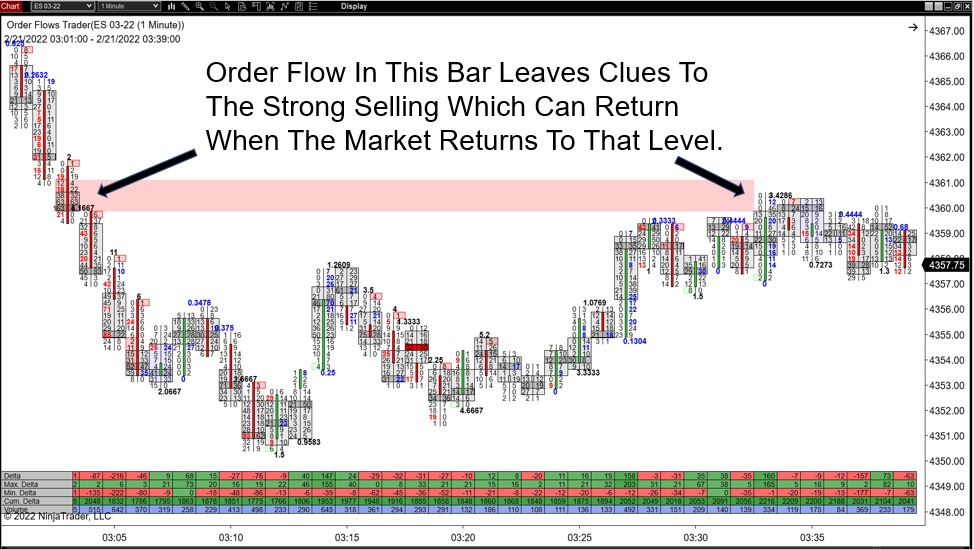
For example, this morning in the ES. The market sold off, rallied back to a particular level and then sold off again. Why did the market rally back to that level and not another level? It is because earlier, there was bearish order there. When the market comes back to an area of bearish order flow, there is a chance that bearish order flow will reappear.
Here it is on a bar chart, you would never notice that level on a bar chart:

Here it is on an Orderflows Trader 5.0 chart. The area is clearly marked so you know where it is:

You don’t have to just play the pullback. When one of these bullish/bearish levels appears, you go with it when the next bar closes away from the level.
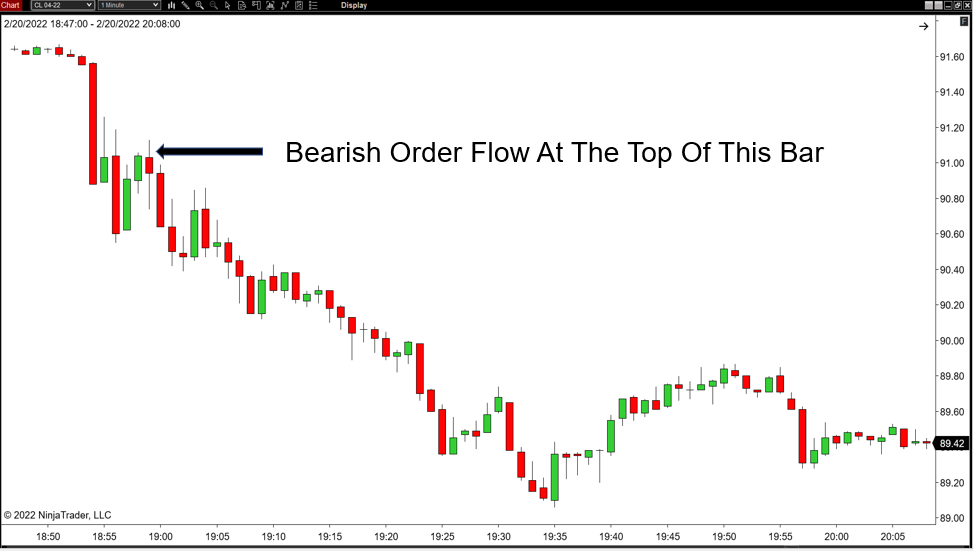
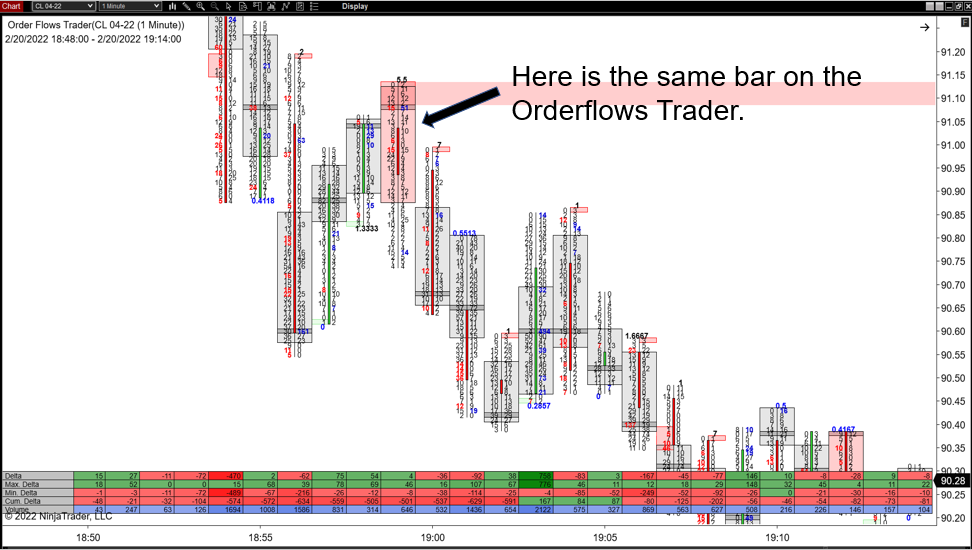
Last night in Crude Oil, the market dropped hard then started to rally. The rally stopped when very bearish order flow appeared. If you trade order flow, you know that you “go-with” the order flow. In this case the bearish order flow. The CL market proceeded to drop another 100 ticks from there.
If you were looking at a bar chart. You would have never noticed the extent of the bearish order flow.


When you get Orderflows Trader 5.0, every Tuesday night, I hold a live training session just for user where I show you how to get the most out of the software. I have been doing this for over 3 years. There are over 150 recordings in the archives, which you have access to as well in case you are unable to join the live session.
You can still get your hands Orderflows Trader 5.0 for the same price as Orderflows Trader 3.0
…for now…
https://www.orderflows.com/oft5.html
I will see you on the inside.


