Orderflows Stratum For NT8
Orderflows Stratum analyzes the volume within the value area and identify areas of strength and weakness.
- Analyzes the volume in the Value Area.
- Identifies those Value Areas with weaker volume.
- Identifies those Value Areas with stronger volume.
- Identifies those areas within Value Area where volume is unevenly distributed.
- Allows you to understand the trading environment better.
What is the Orderflows Stratum?
Hi, I'm Michael Valtos and before starting Orderflows.com in 2015 and I spent 20 years as an institutional trader at JP Morgan, Cargill, Commerzbank, EDF Man, and Dean Witter Reynolds.
In my experience, the single most important part of market analysis is order flow. Order flow gets you as close to the market as possible, and it's essential for making informed trading decisions. When you understand order flow, you can see where the big players are buying and selling, and you can make moves that will capitalize on their trading activity. Order flow is the key to my success in trading, and I believe that it should be the foundation of your market analysis. That's why I spend so much time looking at order flow data when I'm doing my analysis. It's the best way to get a pulse on the market, and to see what's really going on.
But I realize watching and analyzing order flow is not easy for many traders and that is why I create tools and indicators such as the Orderflows Stratum to help traders add order flow to their trading without having to actually look at an order flow chart.

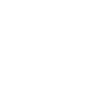
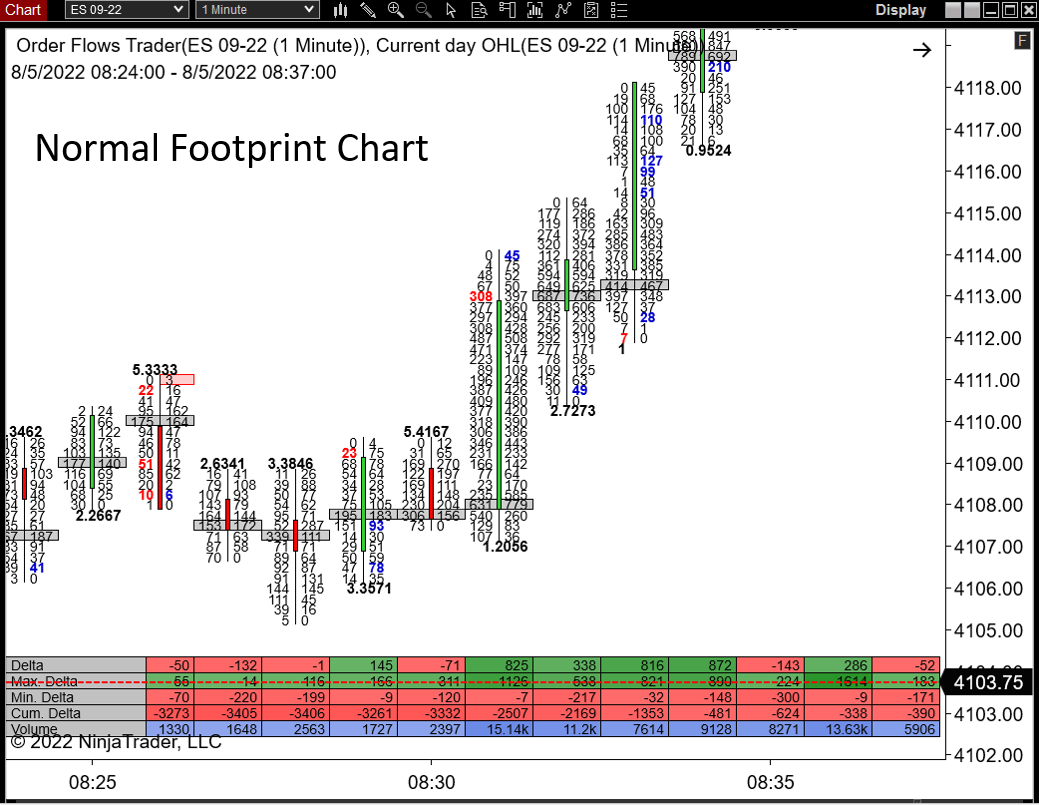
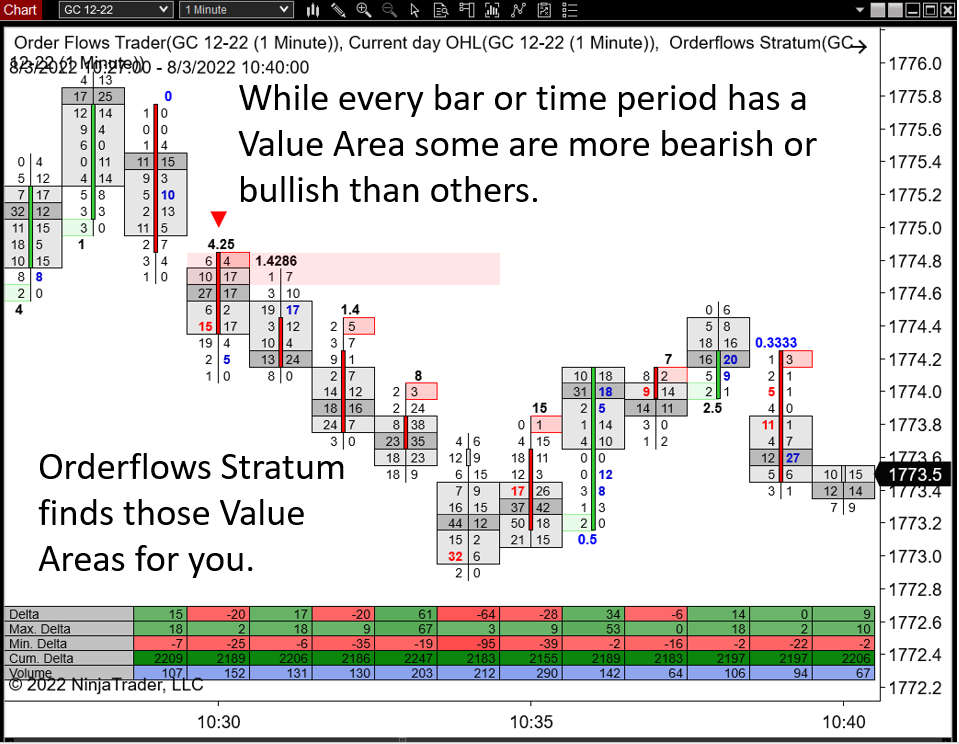
Orderflows Stratum analyzes the Value Area in a bar and looks deeper into the volume within the value area. The Value Area is defined as where 70% of the volume traded in a period or bar. But even within the Value Area there are areas where the volume is strong and areas where volume is weak.
We would like to think that within the Value Area volume is evenly distributed, but there are times where it is not. This is where opportunities arise.
We would like to think that within the Value Area volume is evenly distributed, but there are times where it is not. This is where opportunities arise.
Not All Value Areas Are Created Equal
Every Bar Has A Value Area, But...
Every trading day, time period and bar is different, which means that every value area will develop differently. While the definition of the value area is where 70% of the volume in a bar or time period takes place, that doesn't mean that all value areas are created equal. Sometimes the volume will occur over a small area, other times a larger area. This can be due to a number of factors, including the overall activity level in the market and the specific trading strategy being used by participants. As such, it's important to take into account the unique characteristics of each value area when making trading decisions.
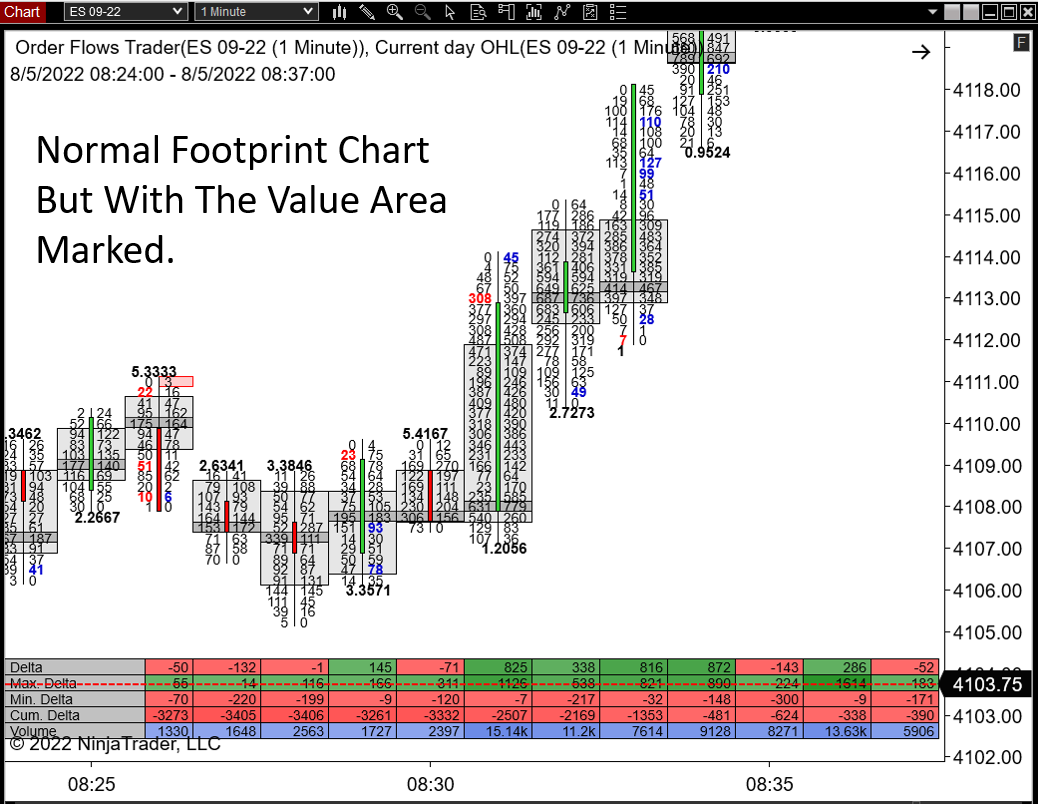
Volume is a critical indicator for trading. It can provide clues about the strength of a move and the participation of market participants. Orderflows Stratum takes volume analysis a step further by looking at the distribution of volume within the Value Area. This allows traders to identify areas of strong and weak volume in the area where volume is strongest.
For example, if there is strong buying volume near the bottom of the Value Area, this could be an indication that the market is ready to move higher as it found support. Conversely, if there is weak selling volume near the top of the Value Area, this could be an indication that the market is ready to move higher as there is less resistance above, even though it is a Value Area High.
Even within the Value Area, there can be areas of strong volume trading and periods of relatively weak trading activity. Although one might think that trading volume would be evenly distributed throughout the Value Area, this is not always the case. Orderflows Stratum's innovative analysis can help traders to identify these areas of strong and weak trading activity, giving you an edge in the market.
Don't Use A Footprint Chart?
No Problem - Use Your Existing Charts!
The Orderflows Stratum will run on your normal candlestick chart. Enabling you to use the Orderflows Stratum with you existing forms of market analysis.
I know not everyone is convinced of the benefits of following the market on an Orderflows.com footprint chart and that is fine. I have designed the Orderflows Stratum to run on a normal bar chart.
Finally, you will have a way to read one of the most important aspects of order flow without having to read an order flow footprint chart. This is the first tool of its kind.
Harness the power of order flow without needing to monitor every tick that goes through! A problem with a lot of indicators is you often have to curve fit it for your market. In other words, you have to find the best settings that worked in the past and hope they work in the futures. That is a recipe for disaster.
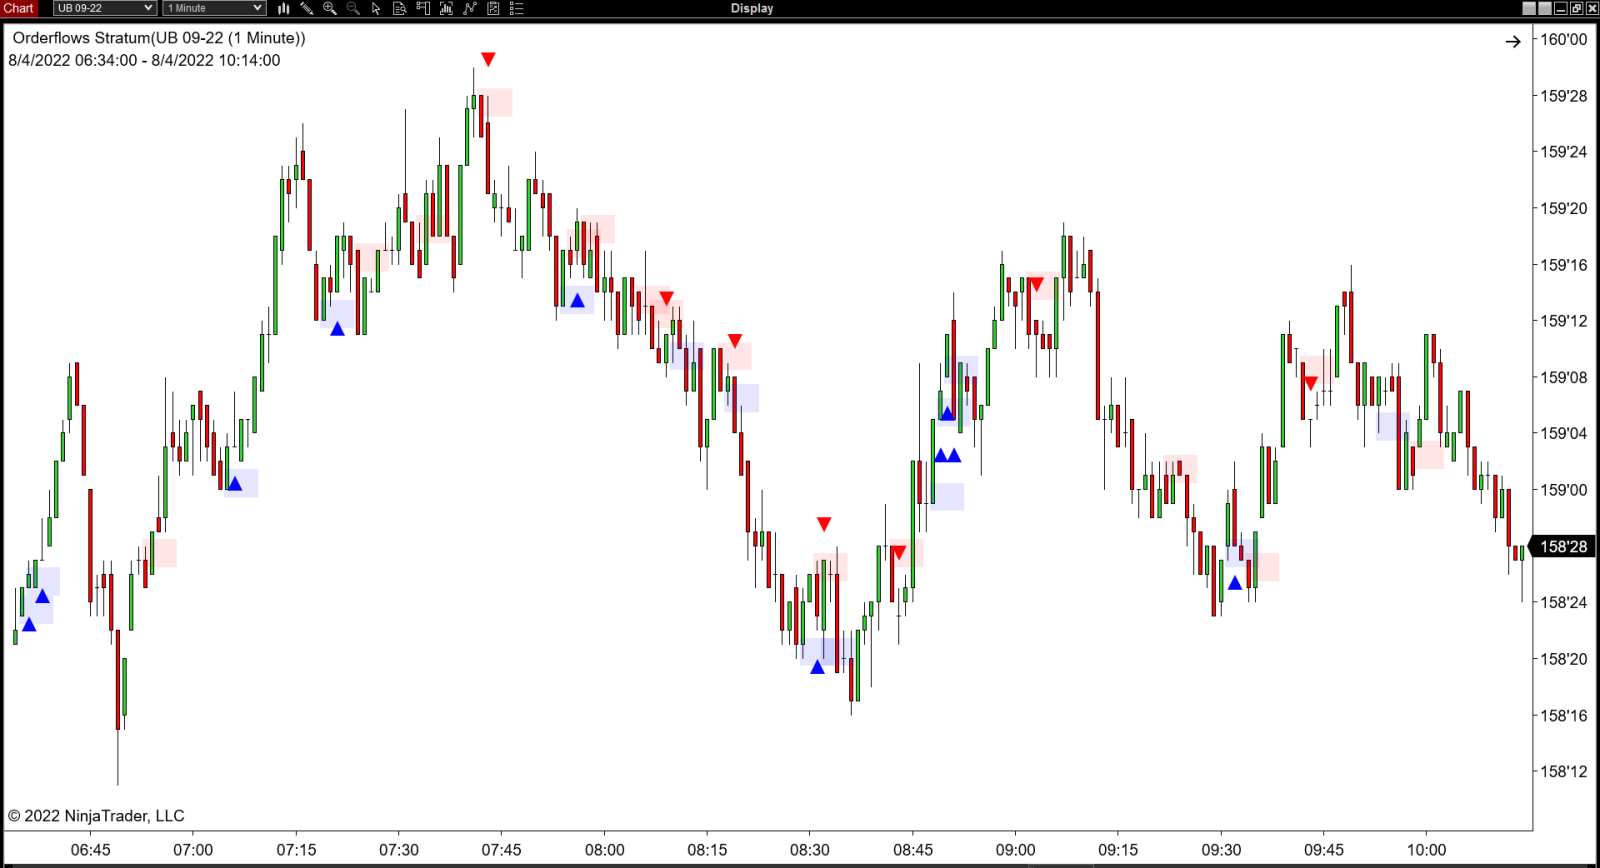
Ultra Bond 1-Minute
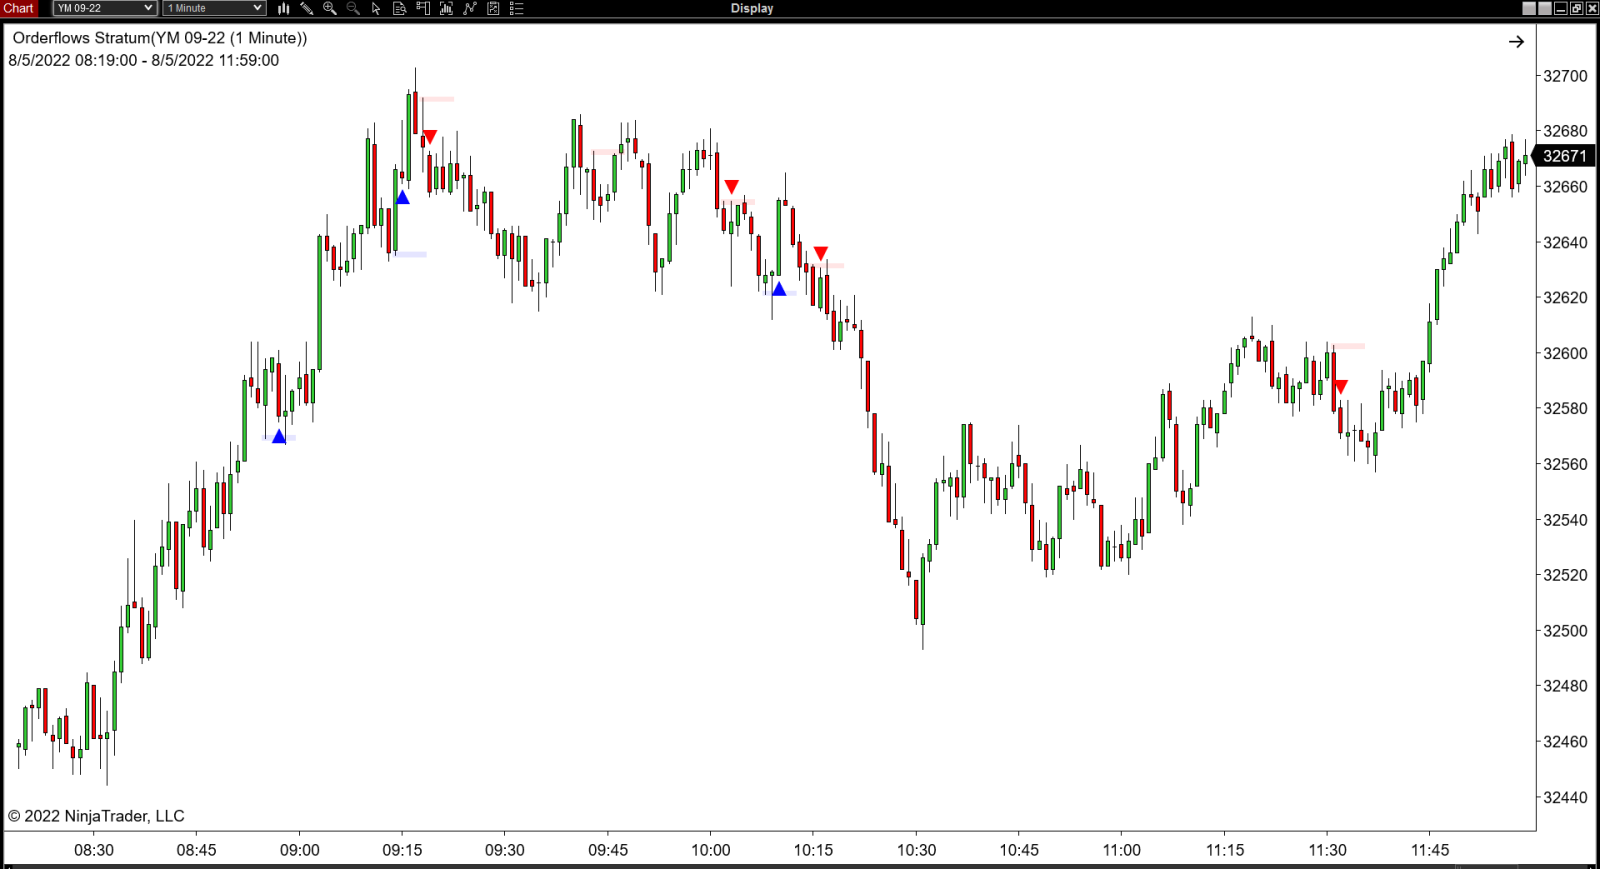
Mini Dow 1-Minute
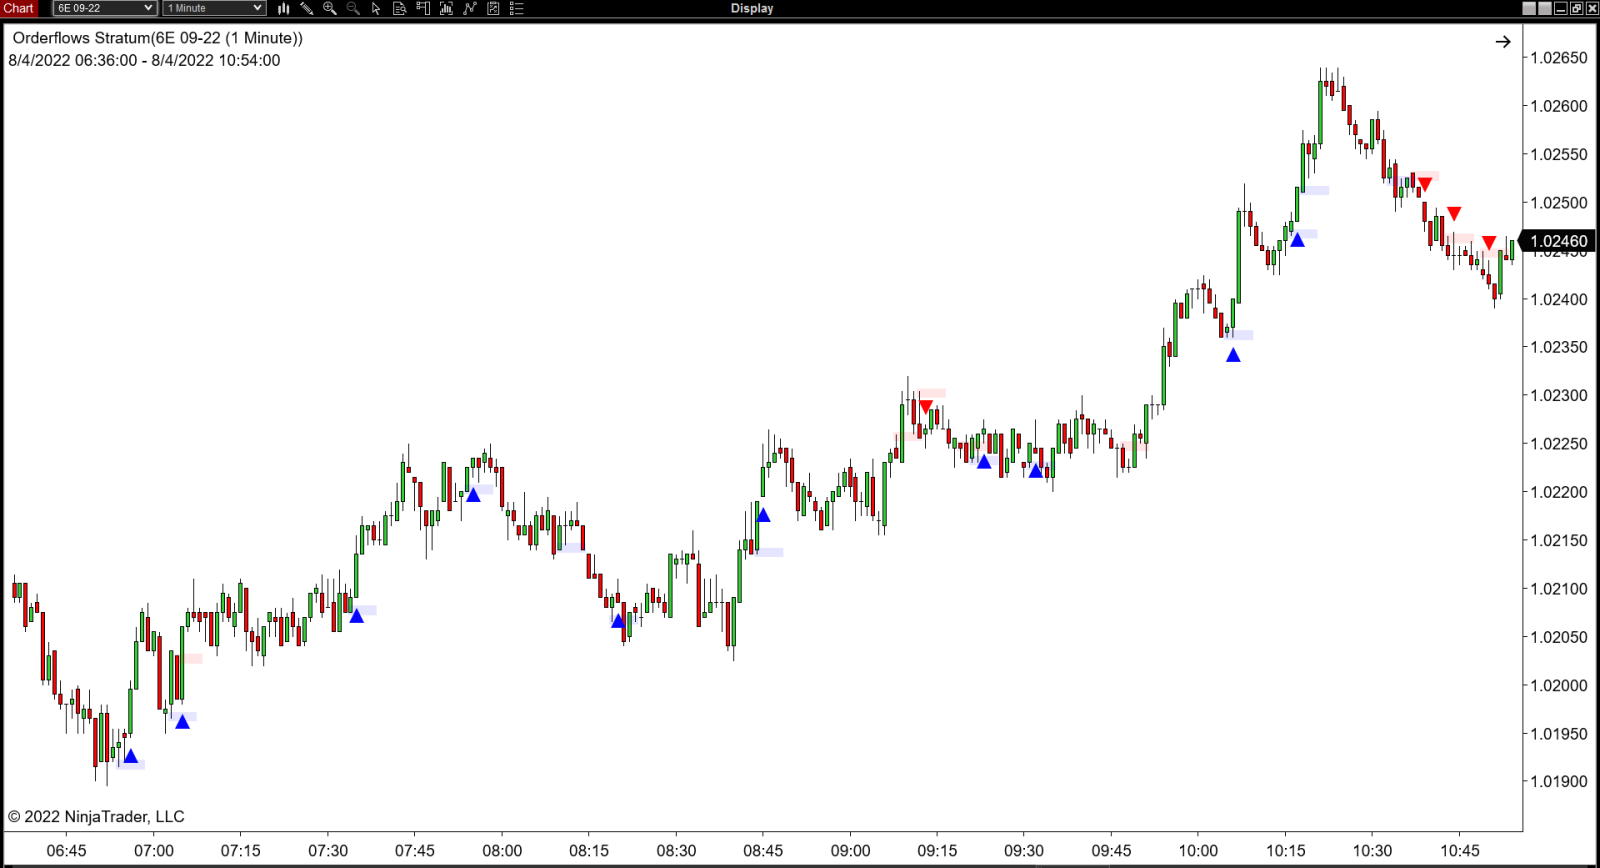
Eurocurrency 1-Minute
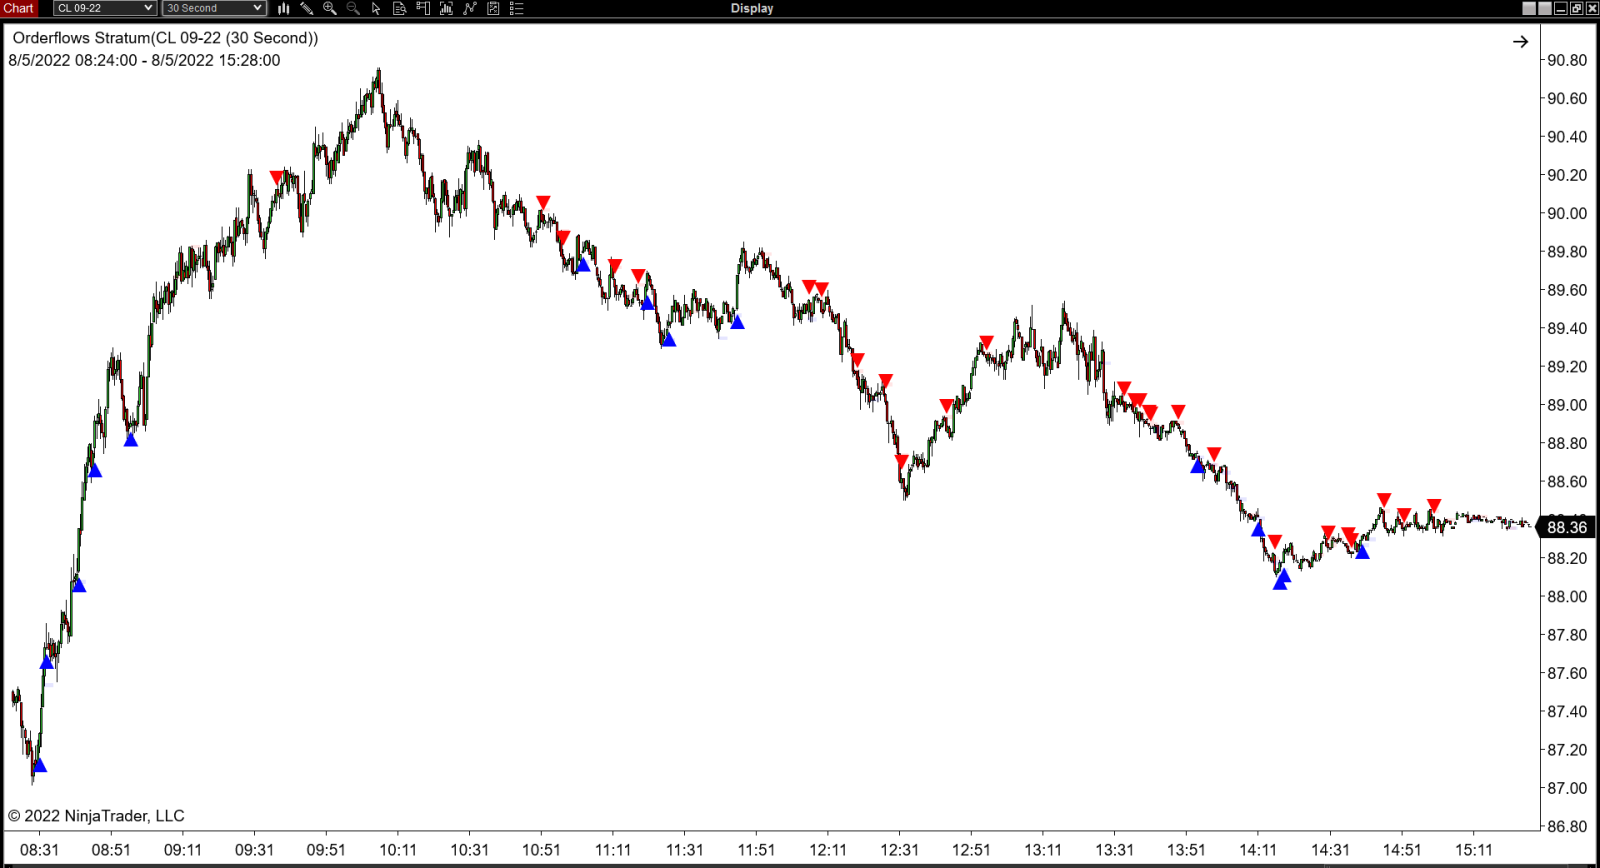
Crude Oil 30-Second
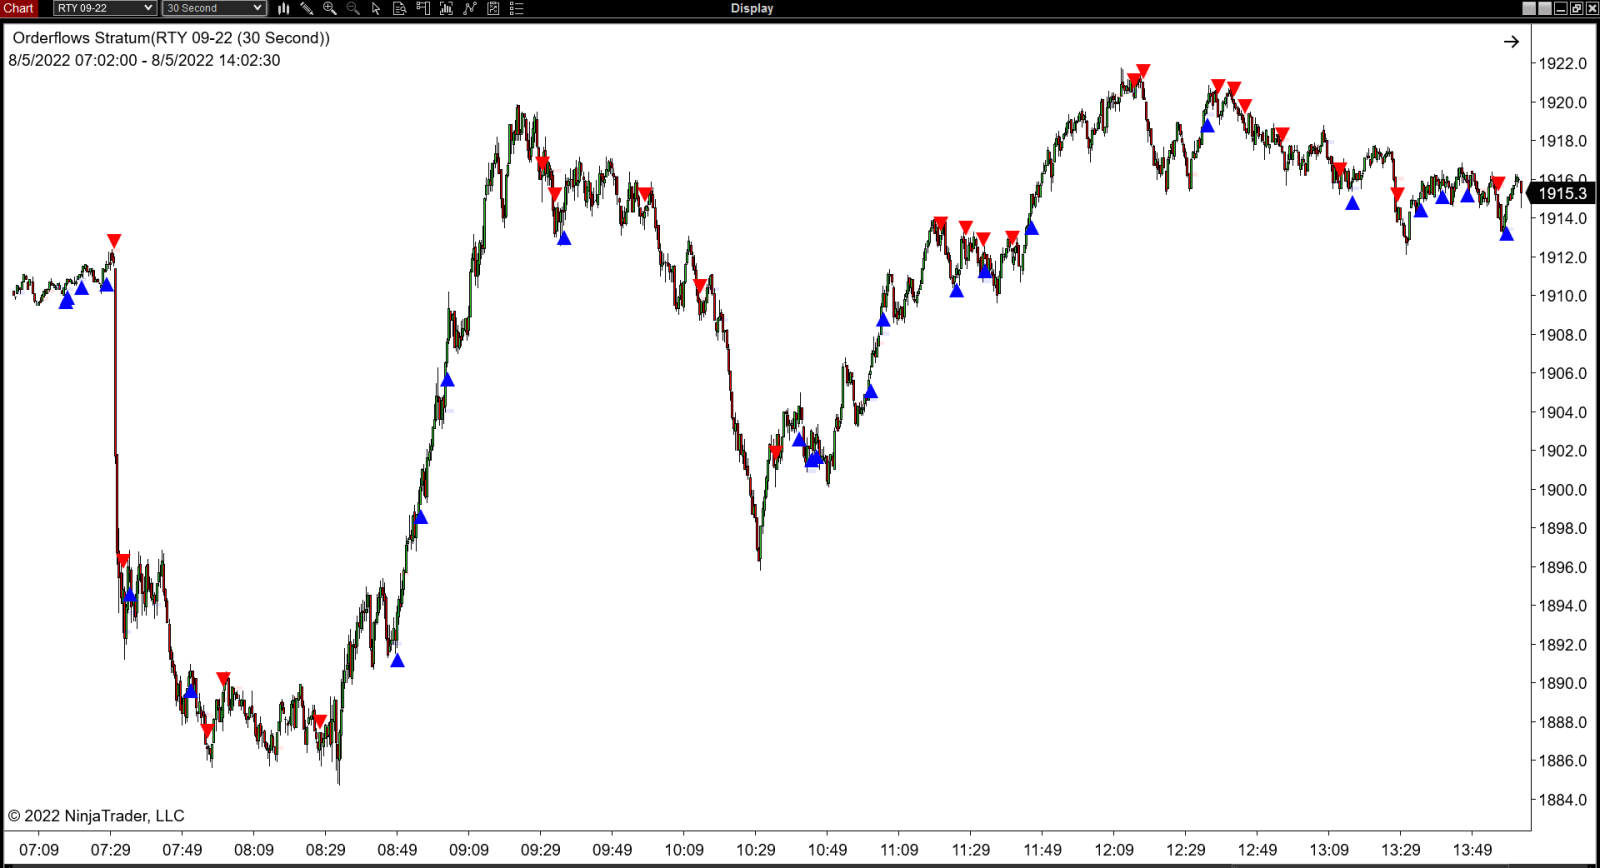
RTY 30-Second
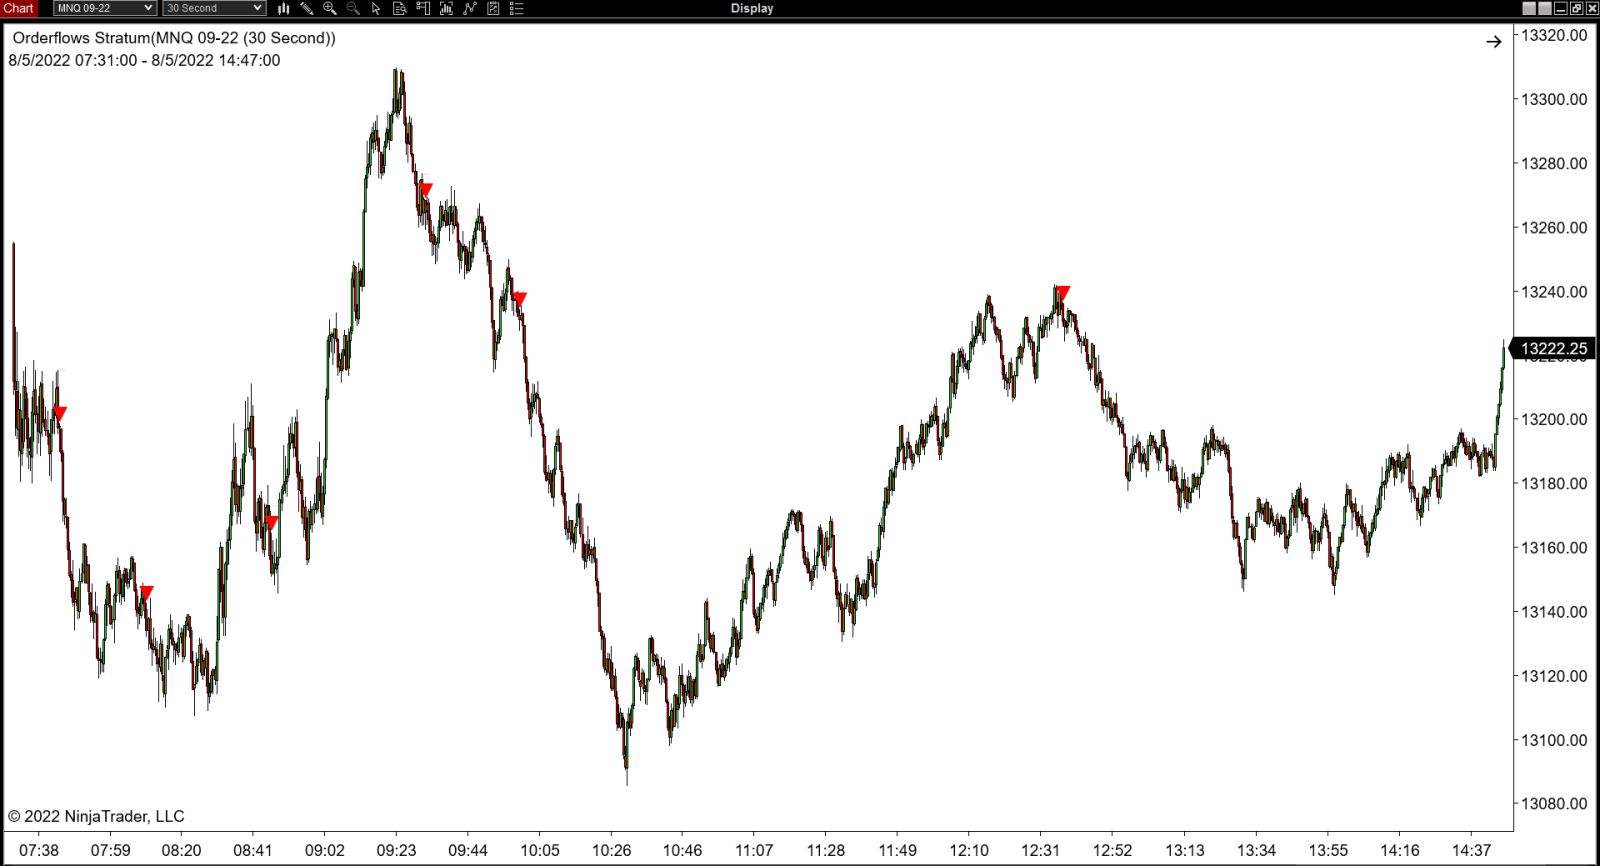
MNQ 30-Second
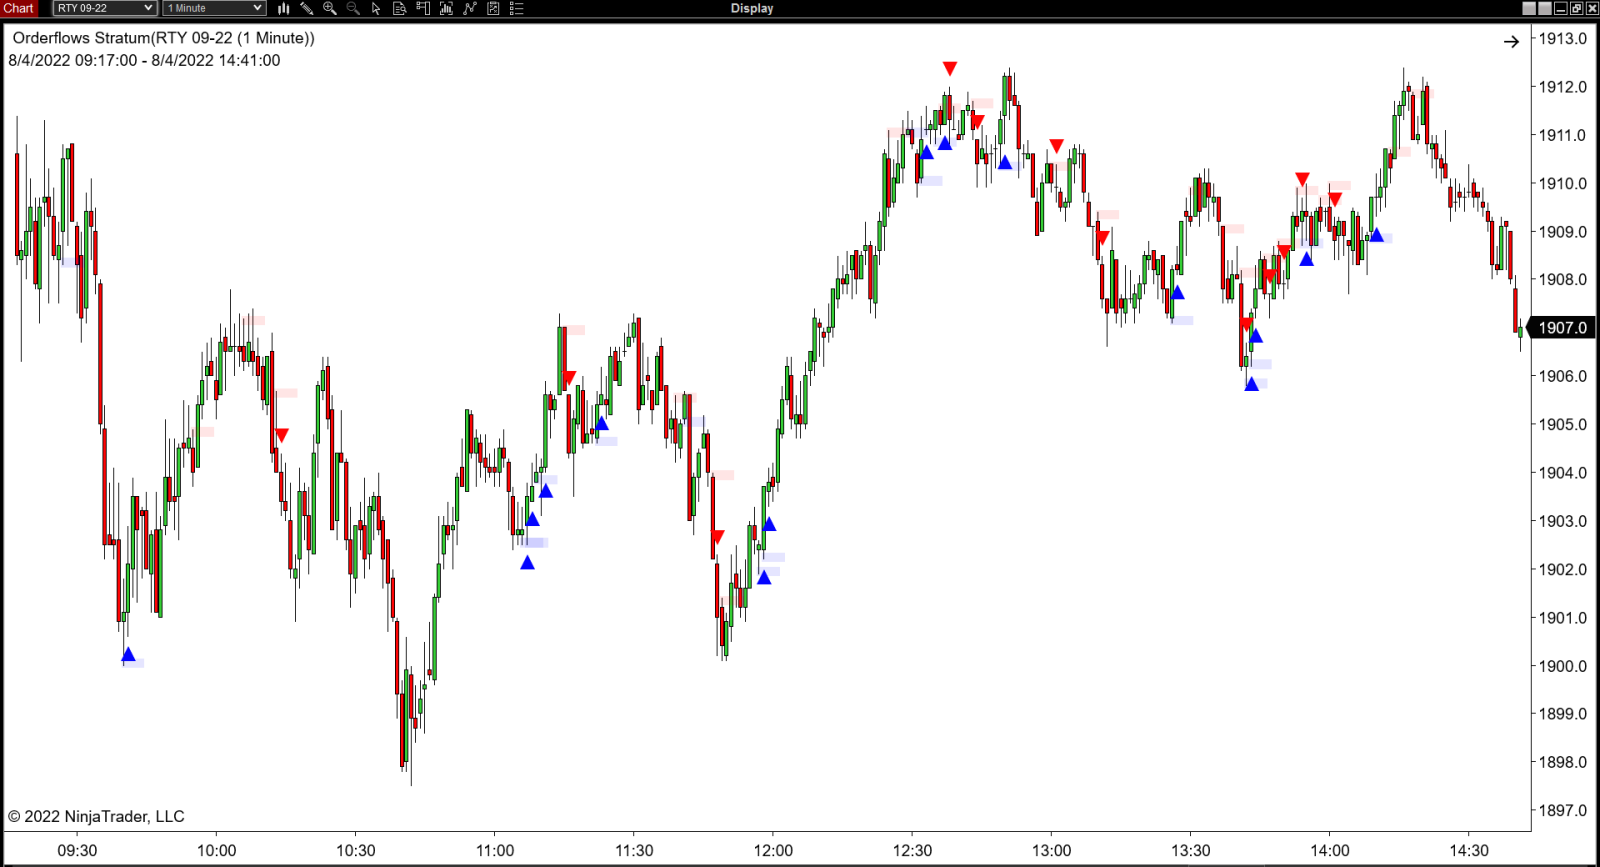
RTY 1-Minute
Order flow trading is all about making decisions based on current market information. And one of the most important pieces of market information is the Value Area. The Value Area is the range of prices where the majority of trading activity takes place. This is usually determined by looking at the volume of trading activity over a certain period of time, such as a day or hour or 30 minutes or even 1 minute periods . When the volume is not distributed properly within the Value Area, it can create opportunities for traders. If you can identify these opportunities, you can potentially make a lot of money. So it's important to understand the Value Area and how it works.
Get Orderflows Stratum now for $399
Clicking on the order link will redirect you to our secure payment processor page on PayPal.
Please allow 3 to 6 hours for us to process your order. We will email you all the necessary files as soon as your order is processed.
Please allow 3 to 6 hours for us to process your order. We will email you all the necessary files as soon as your order is processed.
Let's Take A Look At More Charts
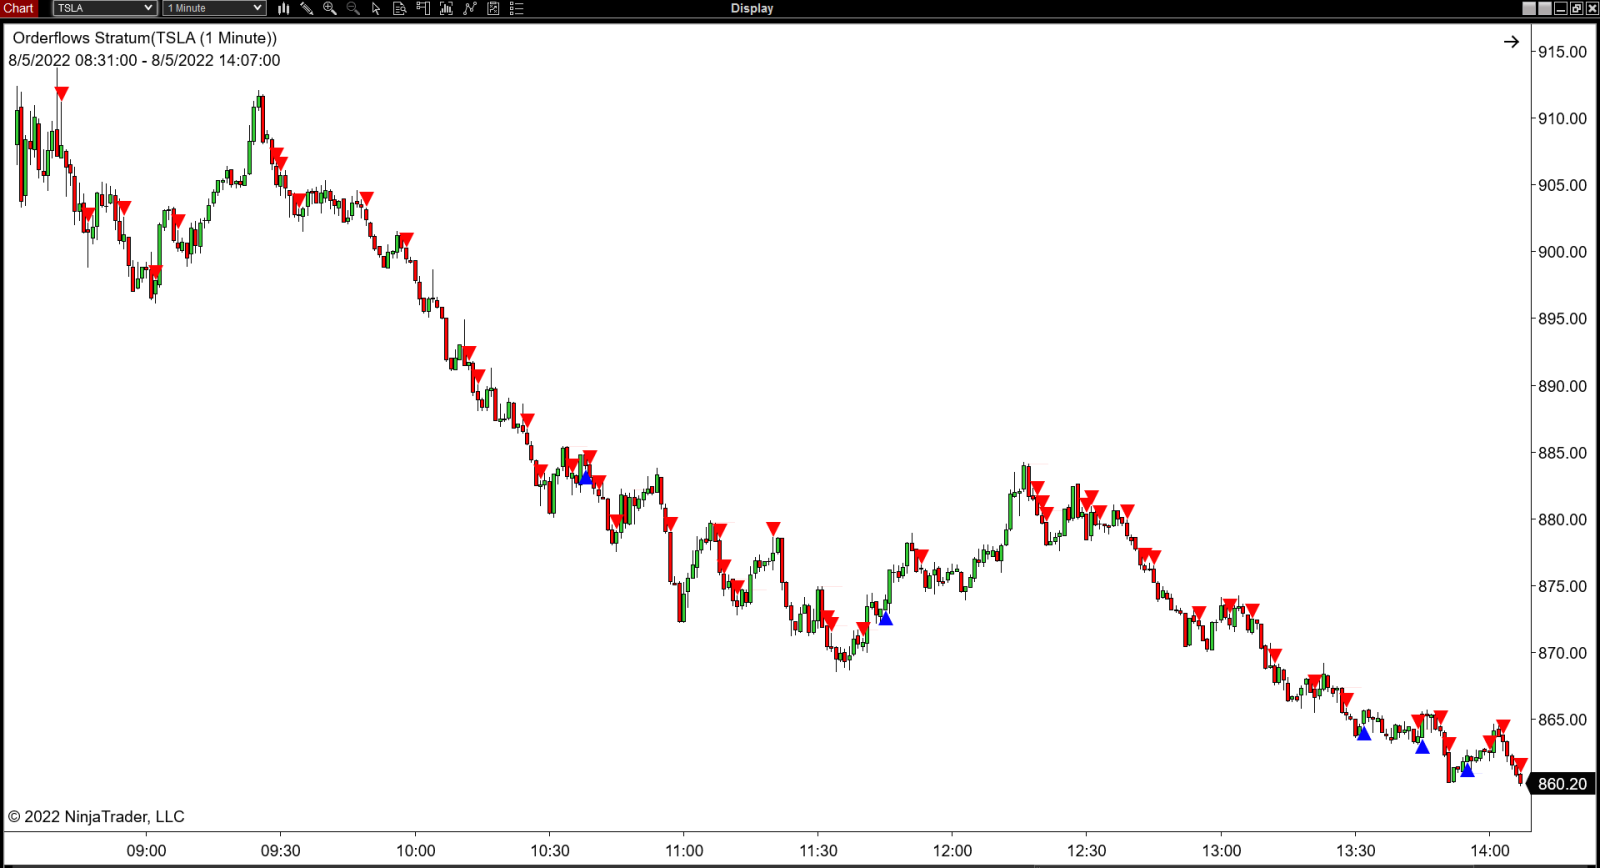
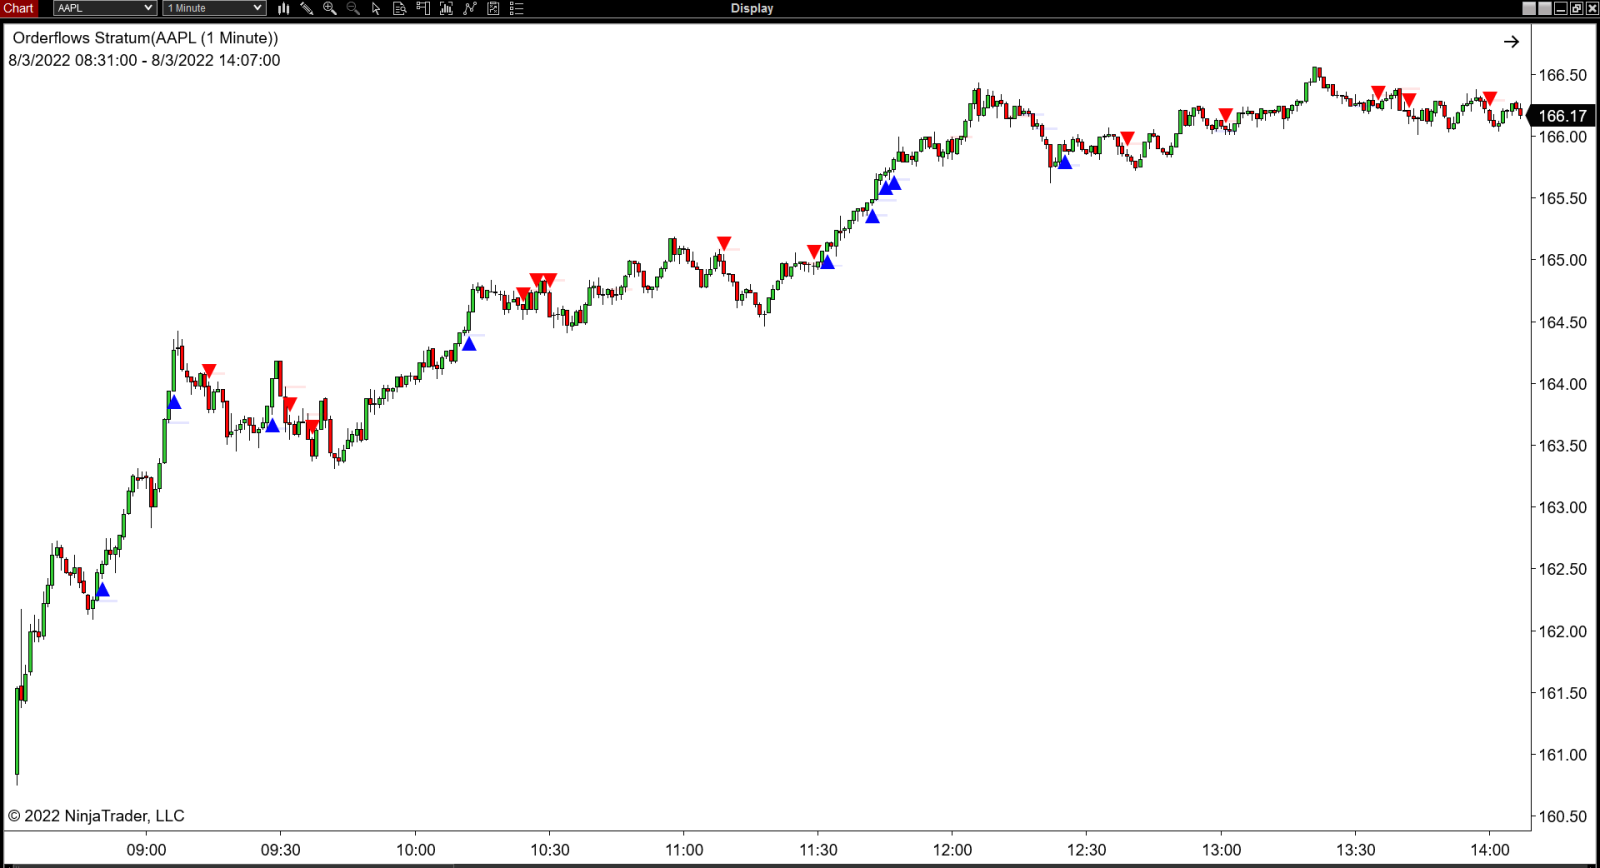
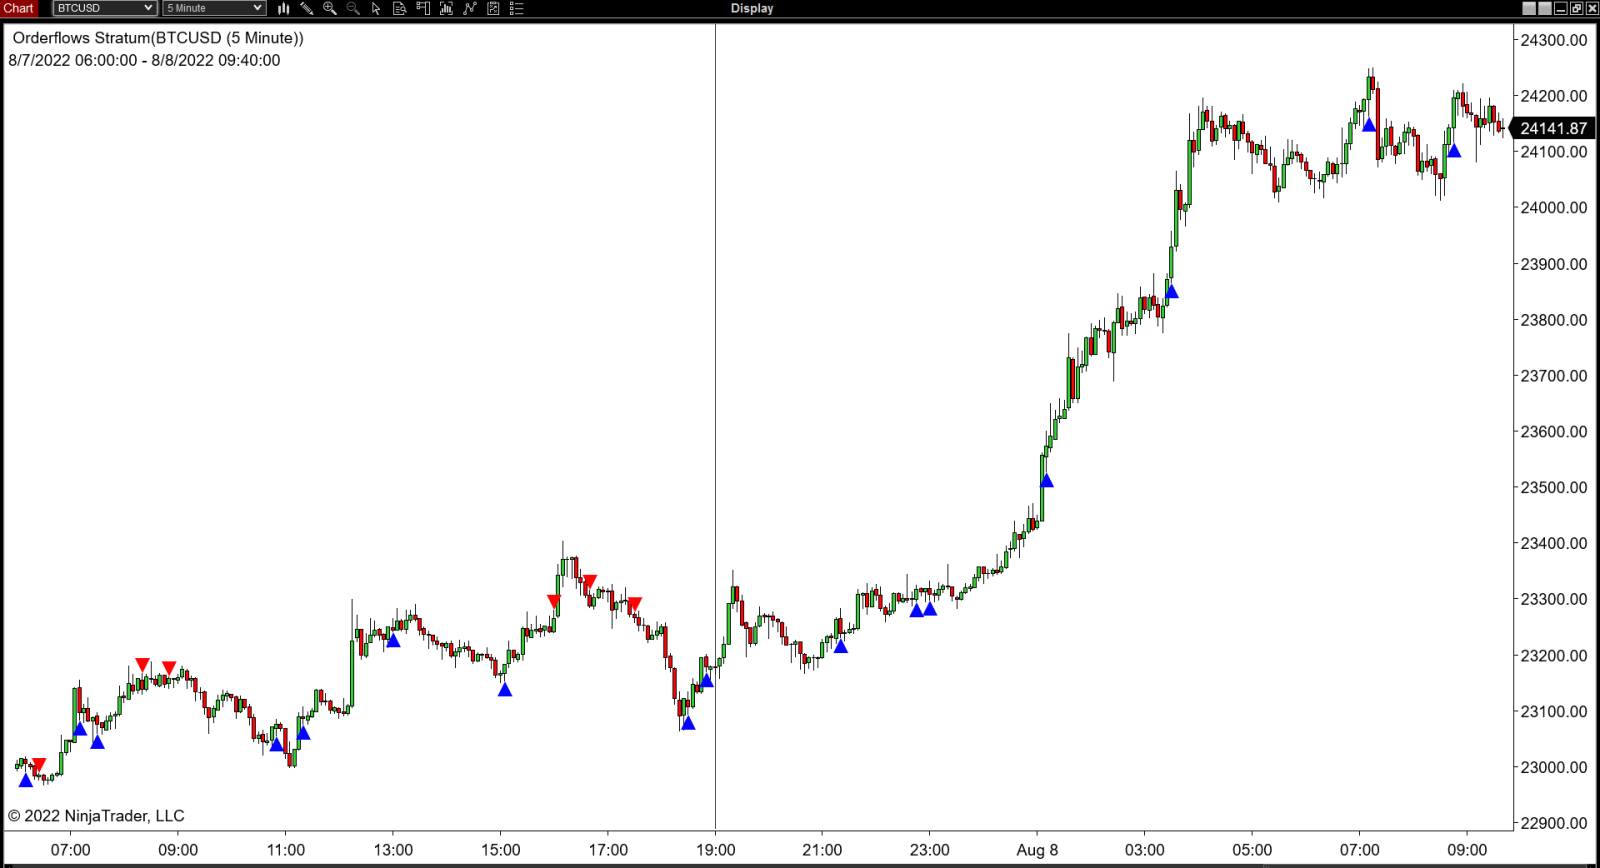
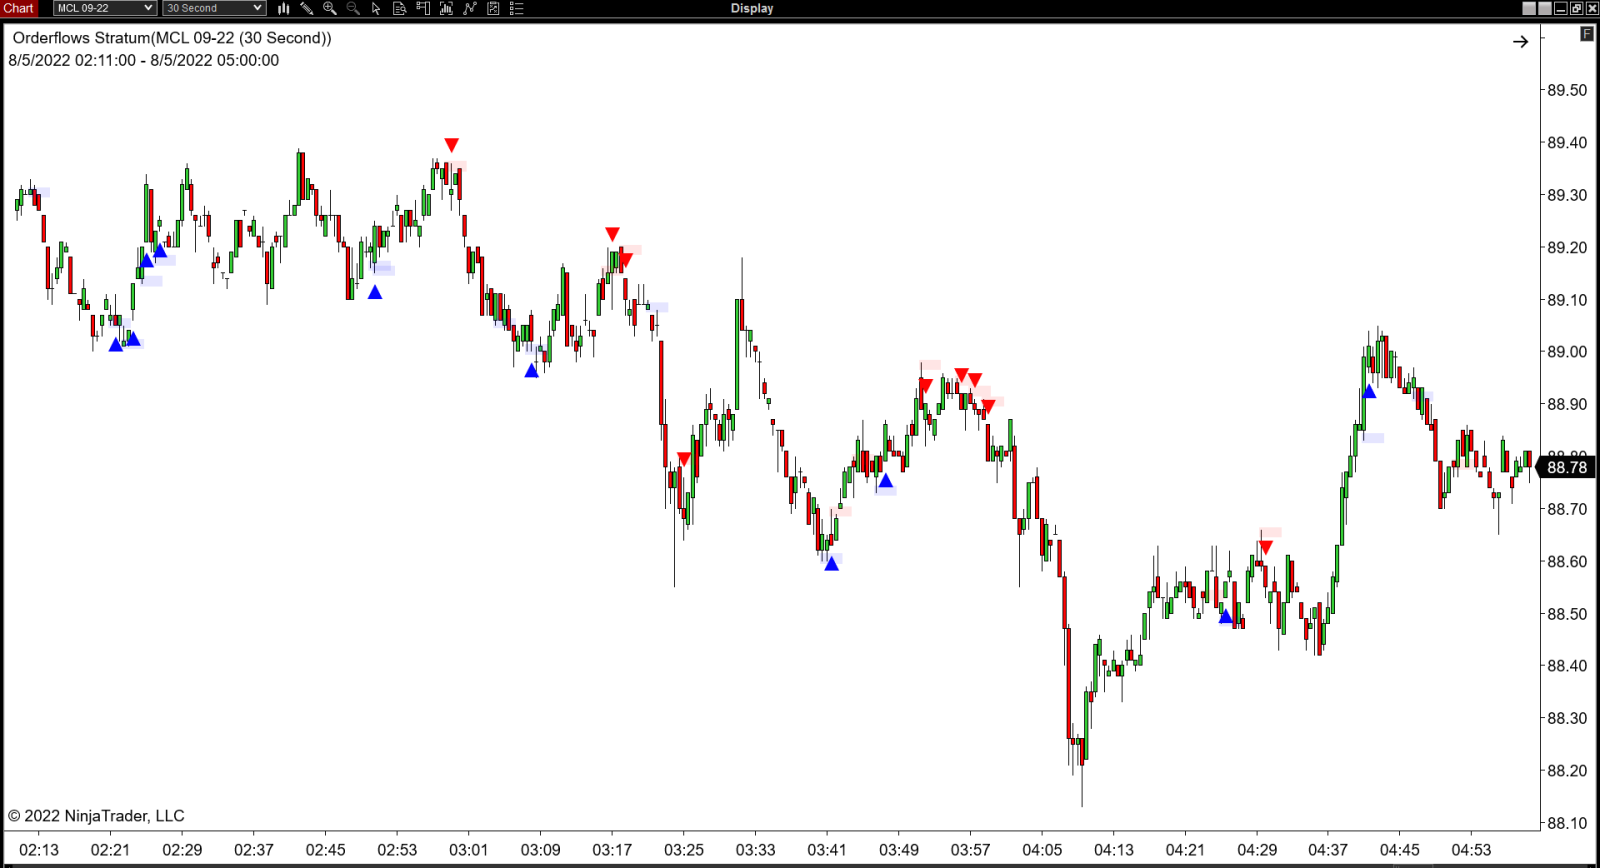
Order flow trading can be a complex and confusing endeavor, but Orderflows Stratum makes it simpler than ever before. I can go on and on about how great it is, but it's probably best to let the pictures do the talking so you can see for yourself. With Orderflows Stratum, you'll be able to see exactly what's going on in the market and make better trading decisions. Trust me, it's worth every penny.
TSLA 1-Minute
AAPL 1-Minute
Bitcoin 5-Minute
MSFT 1-Minute

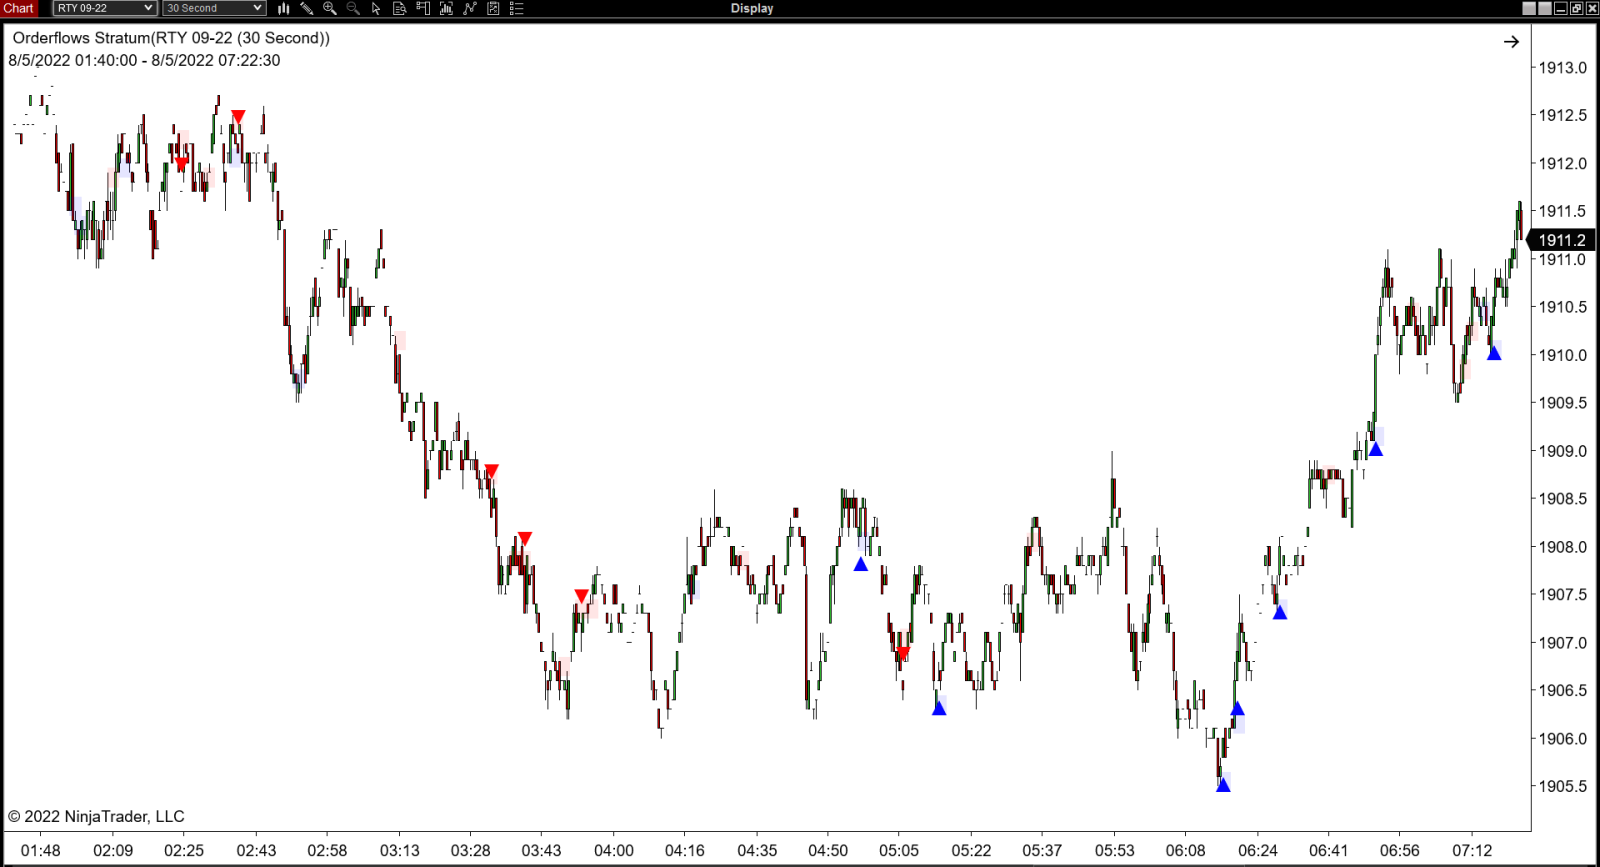
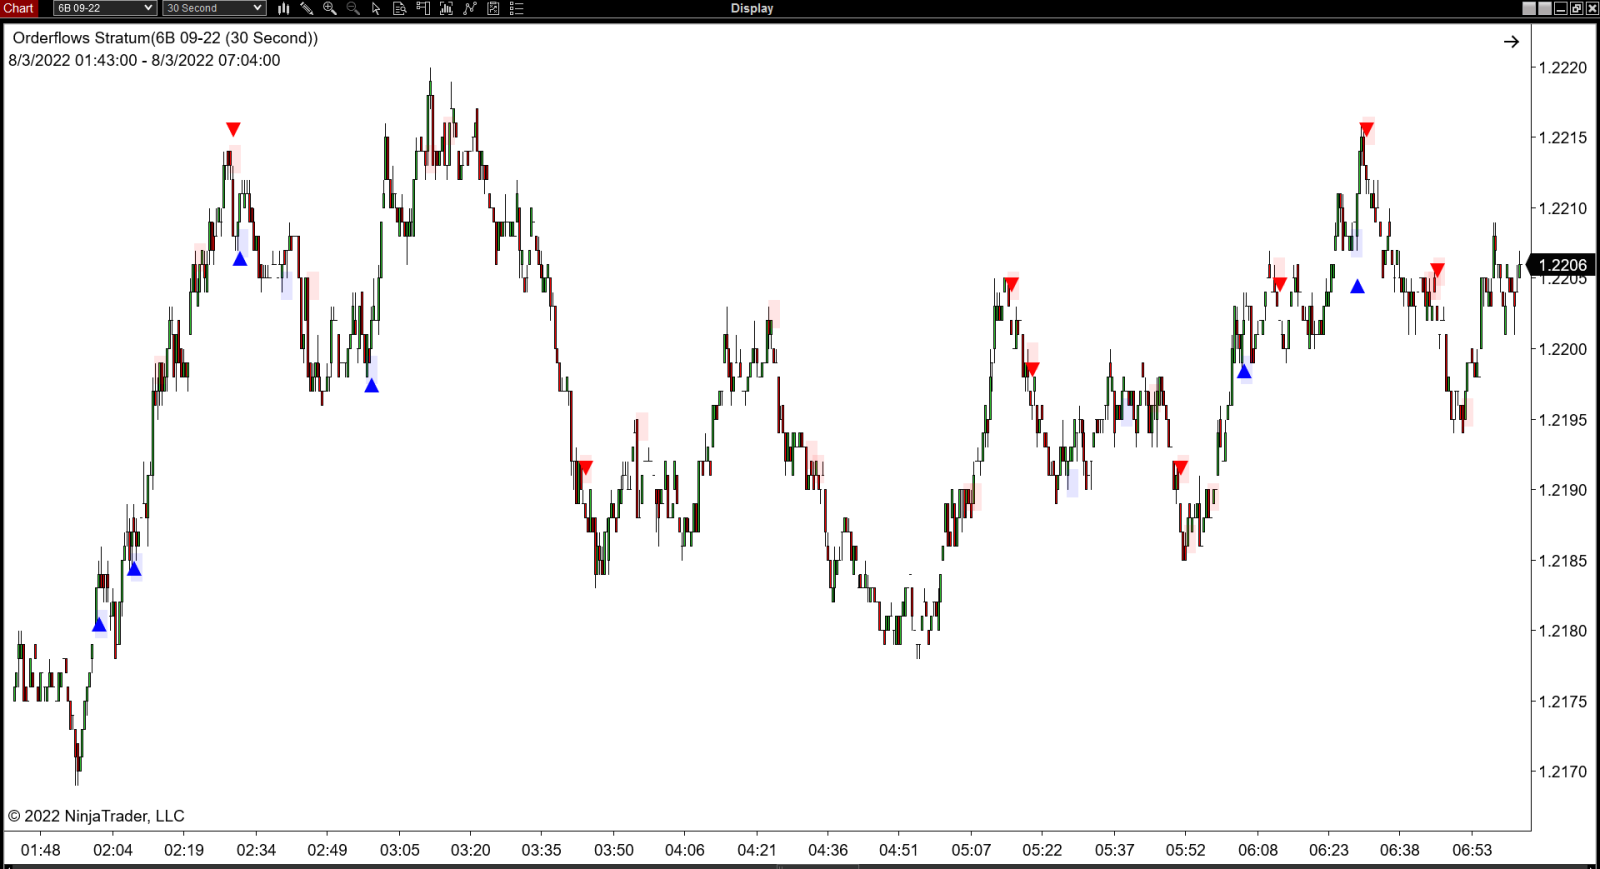
What about the overnight session?
Look at how Orderflows Stratum performs:
Look at how Orderflows Stratum performs:
Micro Crude Oil 30-Second - European Session
RTY 30-Second - European Session
British Pound 30-Second - European Session
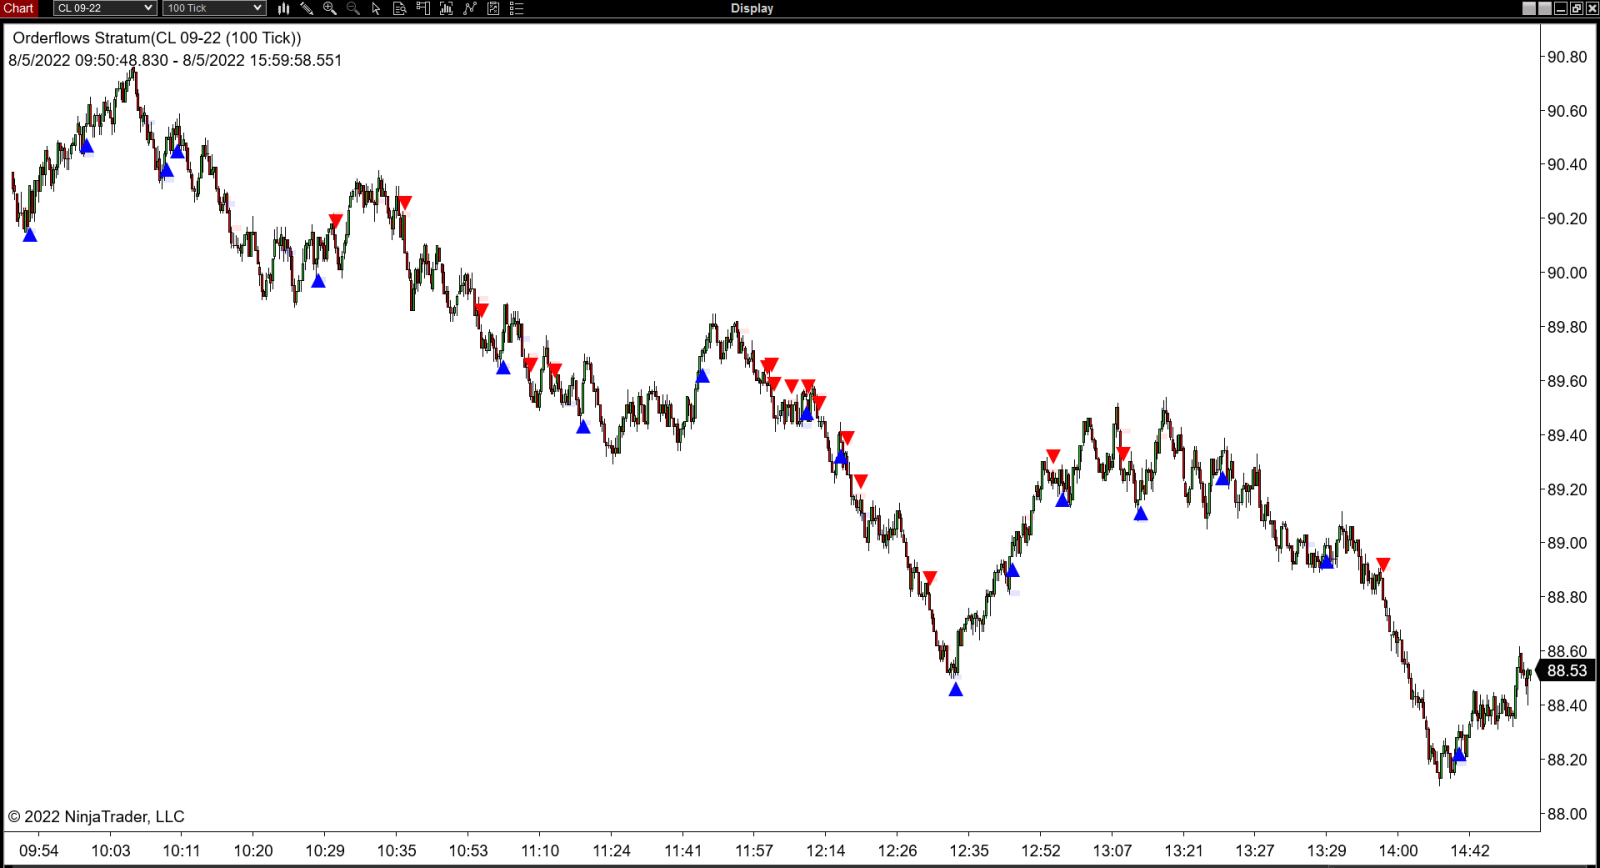
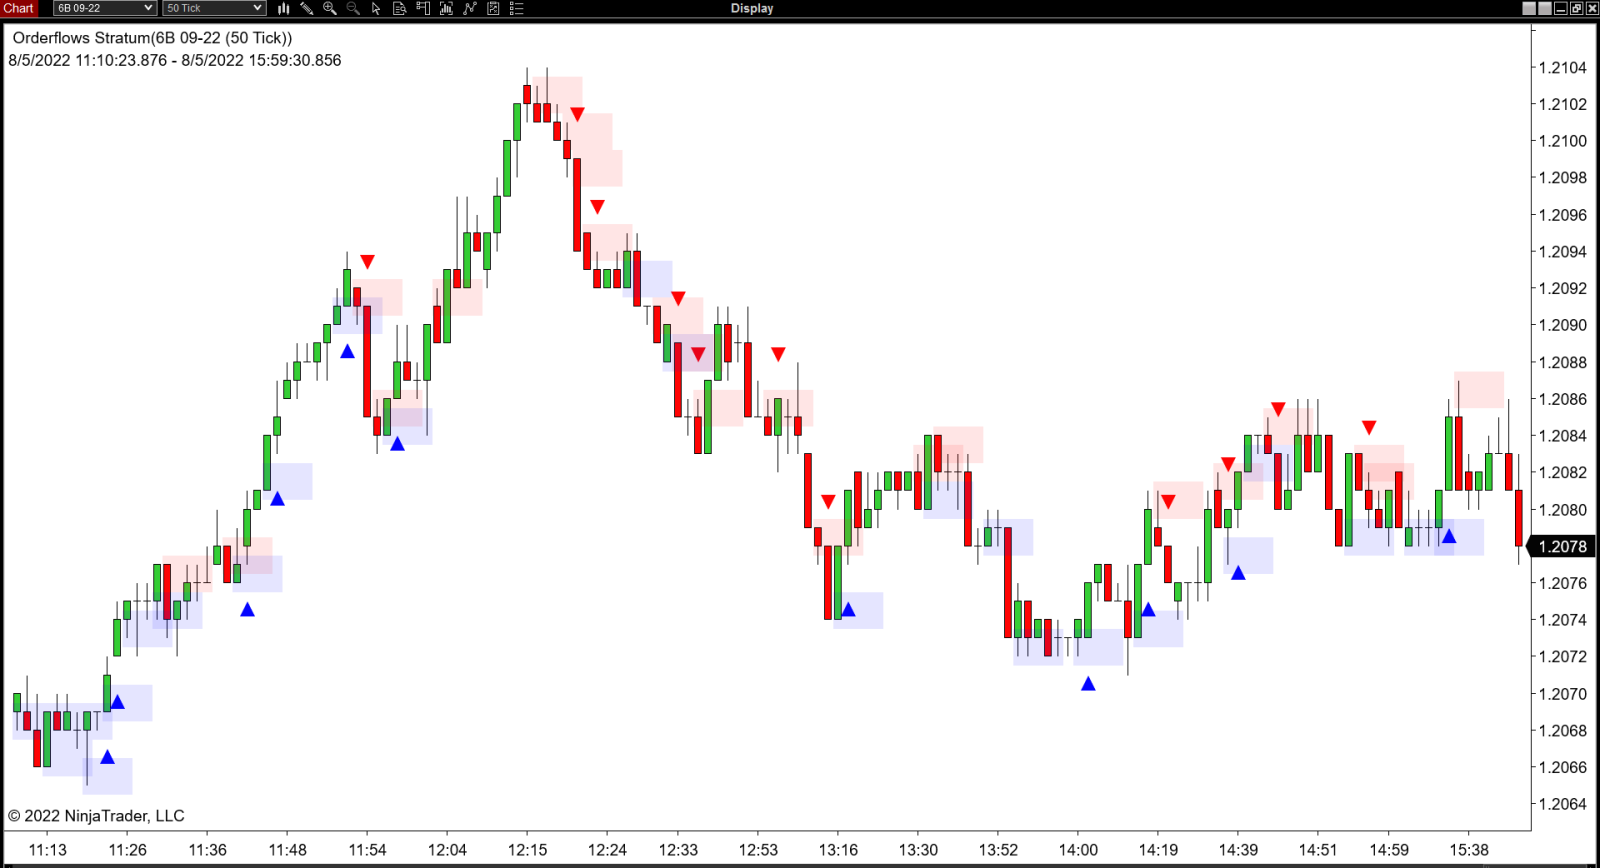
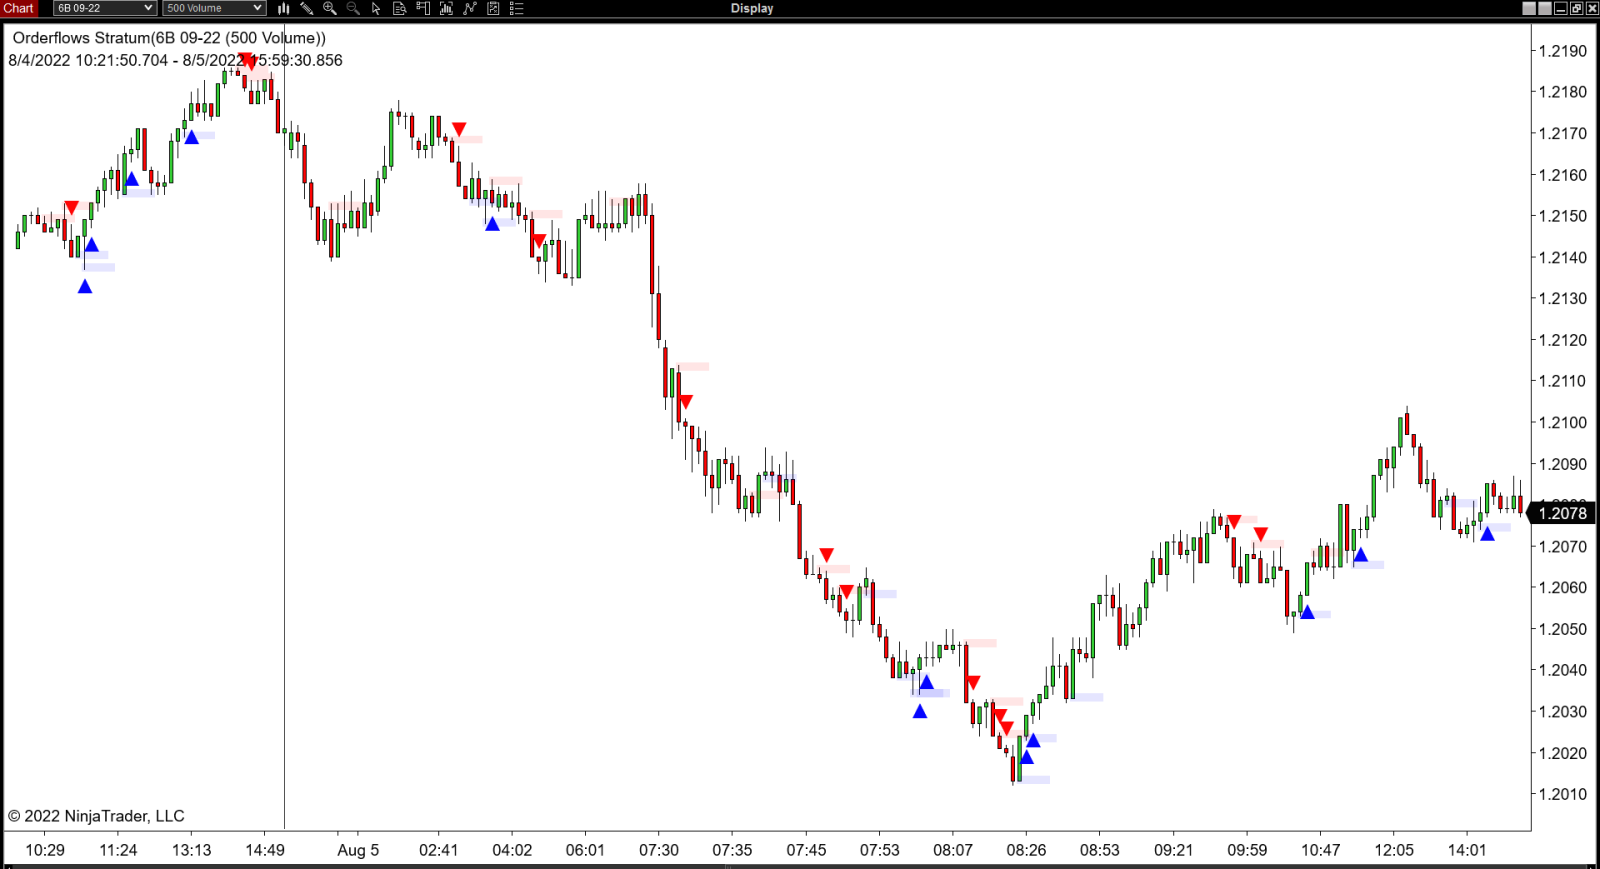
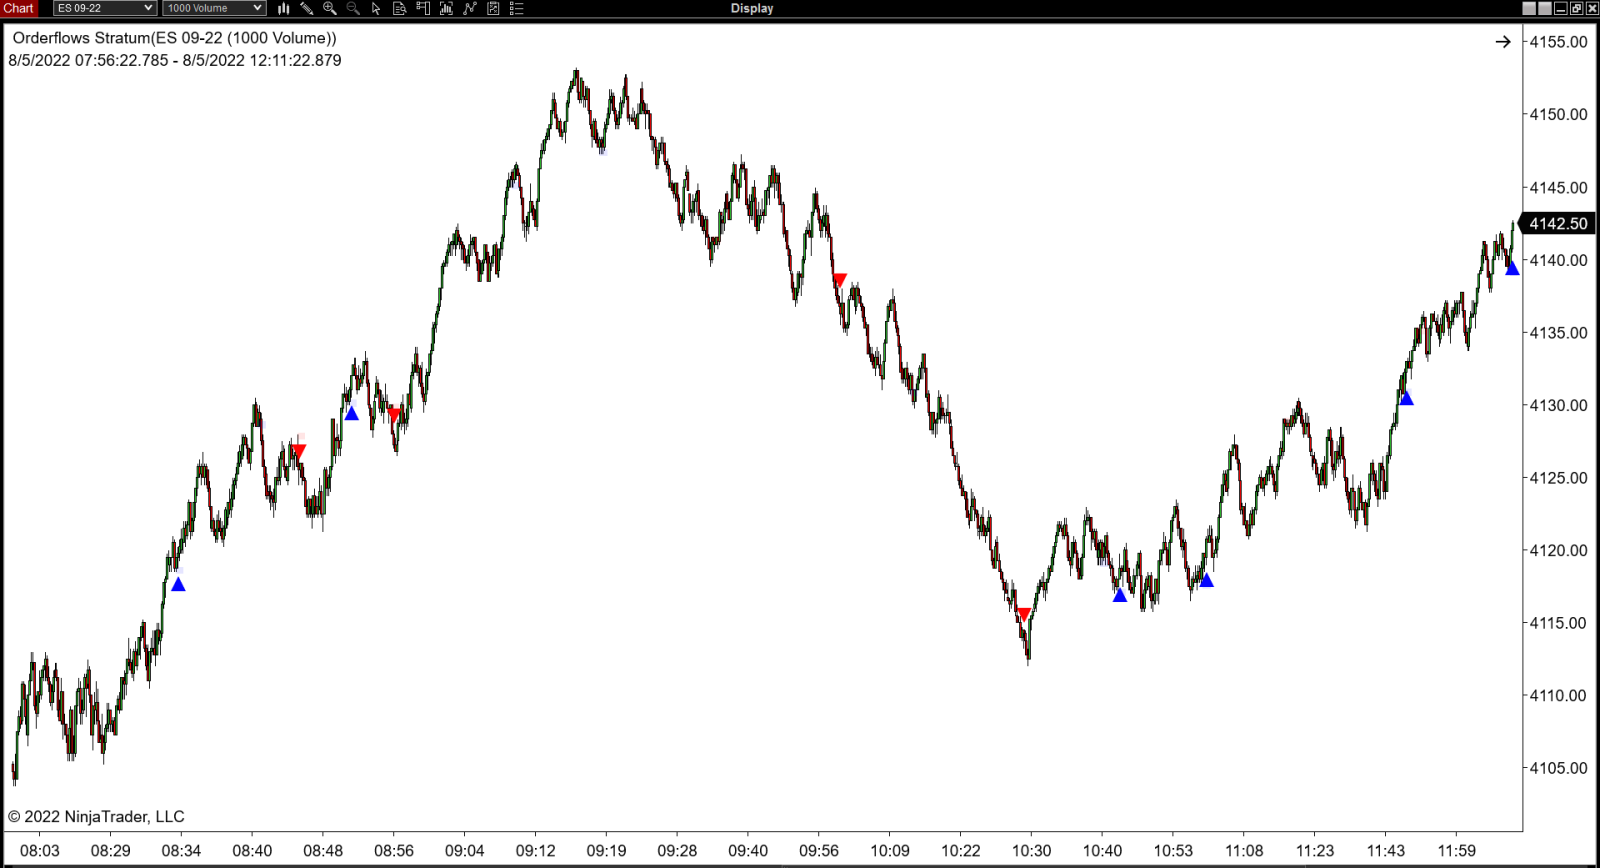
What about Tick and Volume based charts?
Look at how Orderflows Stratum performs:
Look at how Orderflows Stratum performs:
Crude Oil 100-Tick
British Pound 50-Tick
British Pound 500-Volume
E-Mini SP500 1000-Volume
The Orderflows Stratum is programmed with my Trade Entry Signal.
The Trade Entry Signal is something I use in my trading. I use it to help me determine whether to take a trade or pass on the trade. It keeps me out of bad trades, the trades where there is no follow-through order flow in the direction of the trade. If there is no follow-through order flow, the probability the trade will work out is decreased and has a higher chance of failing.
With the Orderflows Stratum Trade Entry Signal will print AFTER the signal bar, not directly on the signal bar.
What this means is when the conditions of the Orderflows Stratum are met, for a trade signal to be generated, the order flow in the next bar(s) needs to be in the direction of the trade signal.
When you disable the Trade Entry Signal, then it will print immediately on the bar, even if there is no follow-through order flow.
You can choose to use the Trade Entry Signal or not use it by unchecking the box next to the work Enable.
You can decide how many ticks you want the market to start moving in the direction of the trade for a trade signal to be generated. I use 2 and the default is set to 2. In slower-moving markets, you can adjust it to 1 if you like.
You can decide in how many bars you want the market to start moving in the direction of a trade for a trade signal to be generated. I use 2 and the default is 2. This means the market must move at least 2 ticks in the direction of the trade within the next 2 bars for a signal to be valid.
The Trade Entry Signal has kept me out of many losing trades over the years.
CLICK HERE TO SECURE YOUR COPY NOW


Frequently Asked Questions
Q Is the Orderflows Stratum a footprint chart?
No. The Orderflows Stratum is an order flow tool that analyzes all the data you would normally see on a footprint chart - the delta, imbalances, POC and volume- PLUS the Value Area.
Q I see you have different markets and different time frames, do I need to follow so many different markets?
No, I show you different markets and different chart types so you can see for yourself how the Orderflows Stratum works under different conditions.
Q Do I need a footprint chart to use the Orderflows Stratum?
No, the Orderflows Stratum will run on a normal bar or candlestick chart as well as a footprint chart.
Q Does the Orderflows Stratum work with Markers Plus from The Indicator Store?
Yes it does.
Q What time frame is best for Orderflows Stratum?
Order flow in general is best for shorter time frames. If you trade anything from 30-second charts to 5-minutes, Orderflows Stratum performs well. When you start analyzing order flow over 15 minutes, the order flow that happened earlier is not as relevant.
Q I trade Forex, can I use the Orderflows Stratum to analyze FX markets?
Not really. Forex data is not centralized so analyzing order flow from various sources is not an ideal situation. If you want to trade Forex, I would suggest you trade the FX futures available at the CME where the data is centralized and better to analyze the order flow.
Q Do I need the PAID version of NinjaTrader 8 or can I use the FREE version?
The Orderflows Stratum will run on the PAID version as well as the FREE version of NT8.
Q What markets work best with Orderflows Stratum?
Futures and stocks work best with the Orderflows Stratum.
Q I use Sierra Chart, is the Orderflows Stratum available for Sierra Chart?
No. At the moment the Orderflows Stratum is only available for NT8.
Q Is there a sound alert?
Yes, there is a default sound alert that you can change to your own custom .wav file.
Q What platform does the Orderflows Stratum work on?
The Orderflows Stratum is programmed for NinjaTrader 8.
Q Is there a free trial
Unfortunately, we no longer offer free trials on our software.
Copyright 2022 - Orderflows.com - All rights reserved
CFTC Rules 4.41:
Hypothetical Or Simulated Performance Results Have Certain Limitations, Unlike An Actual Performance Record, Simulated Results Do Not Represent Actual Trading. Also, Since The Trades Have Not Been Executed, The Results May Have Under-Or-Over Compensated For The Impact, If Any, Of Certain Market Factors, Such As Lack Of Liquidity. Simulated Trading Programs In General Are Also Subject To The Fact That They Are Designed With The Benefit Of Hindsight. No Representation Is Being Made That Any Account Will Or Is Likely To Achieve Profit Or Losses Similar To Those Shown.
Disclaimer:
This Presentation Is For Educational And Informational Purposes Only And Should Not Be Considered A Solicitation To Buy Or Sell A Futures Contract Or Make Any Other Type Of Investment Decision. Futures Trading Contains Substantial Risk And Is Not For Every Investor. An Investor Could Potentially Lose All Or More Than The Initial Investment. Risk Capital Is Money That Can Be Lost Without Jeopardizing Ones Financial Security Or Life Style. Only Risk Capital Should Be Used For Trading And Only Those With Sufficient Risk Capital Should Consider Trading. Past Performance Is Not Necessarily Indicative Of Future Results.
Risk Disclosure:
Futures And Forex Trading Contains Substantial Risk And Is Not For Every Investor. An Investor Could Potentially Lose All Or More Than The Initial Investment. Risk Capital Is Money That Can Be Lost Without Jeopardizing Ones’ Financial Security Or Life Style. Only Risk Capital Should Be Used For Trading And Only Those With Sufficient Risk Capital Should Consider Trading. Past Performance Is Not Necessarily Indicative Of Future Results.
Hypothetical Performance Disclosure:
Hypothetical Performance Results Have Many Inherent Limitations, Some Of Which Are Described Below. No Representation Is Being Made That Any Account Will Or Is Likely To Achieve Profits Or Losses Similar To Those Shown; In Fact, There Are Frequently Sharp Differences Between Hypothetical Performance Results And The Actual Results Subsequently Achieved By Any Particular Trading Program. One Of The Limitations Of Hypothetical Performance Results Is That They Are Generally Prepared With The Benefit Of Hindsight. In Addition, Hypothetical Trading Does Not Involve Financial Risk, And No Hypothetical Trading Record Can Completely Account For The Impact Of Financial Risk Of Actual Trading. For Example, The Ability To Withstand Losses Or To Adhere To A Particular Trading Program In Spite Of Trading Losses Are Material Points Which Can Also Adversely Affect Actual Trading Results. There Are Numerous Other Factors Related To The Markets In General Or To The Implementation Of Any Specific Trading Program Which Cannot Be Fully Accounted For In The Preparation Of Hypothetical Performance Results And All Which Can Adversely Affect Trading Results.
Thanks for subscribing. Share your unique referral link to get points to win prizes..
Loading..